|
May 10, 2020
Dear Neighbors and Friends:
I hope that you and your loved ones are doing well, staying healthy, and looking out for your neighbors and friends.
And a Happy Mothers Day to all you mothers and children of mothers out there!
I’m happy to report that today’s report includes no new deaths from COVID. Today’s newsletter is mainly graphs and charts. For me, this weekend was a welcome break from briefings and policy decisions/reports. I was able to vote, donate platelets, and enjoy a Mothers Day that was different in some ways, but fundamentally the same in others. Hope the same was true for you.
TODAY’S CORONAVIRUS AND CORONAVIRUS RESPONSE UPDATE
-
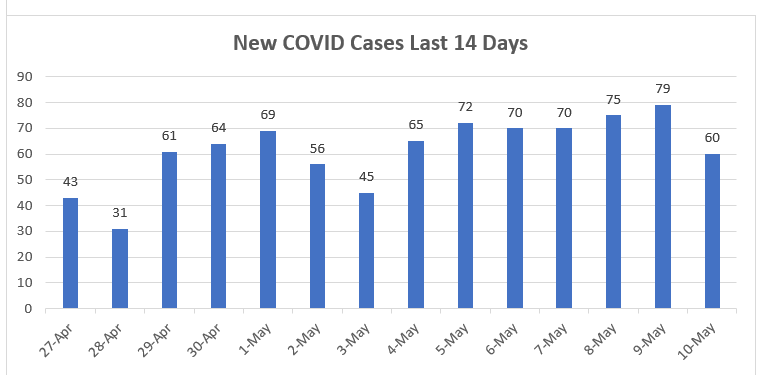
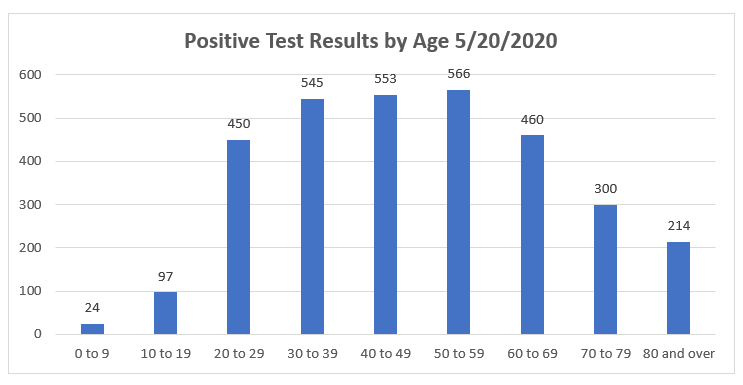
Positive Cases: OHA has reported that 60 additional Oregonians tested positive for COVID-19 yesterday, putting the total at 3,171.
-
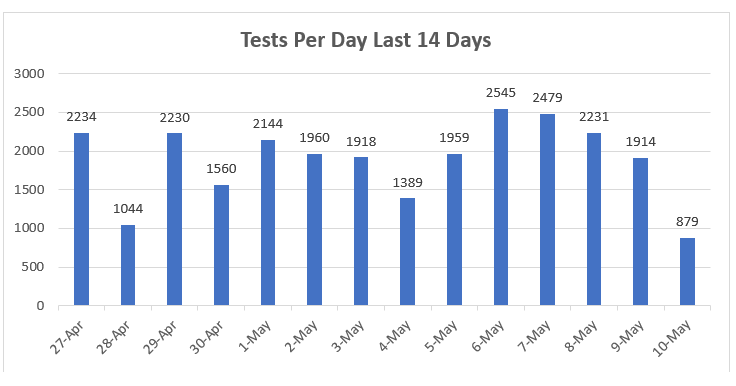
Total Tests: The total number of tests in Oregon now stands at 75,450. That’s an increase of just 879 tests. Not sure why this number is so low.
-
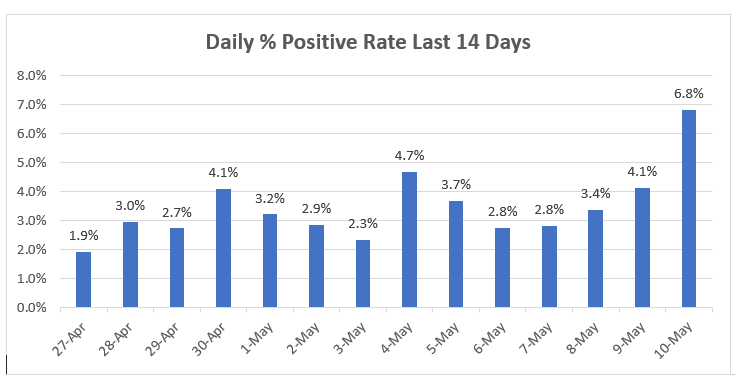
Ratio: The percentage of positive results for today has risen to 6.8%. That remains just slightly lower than the national percentage reported today, which is 7.8%. See below for a graph showing Oregon’s daily ratio changes over the last 14 days.
-
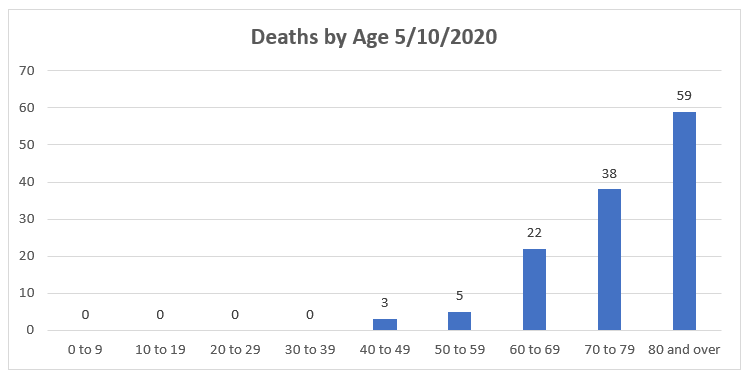
Deaths: I’m happy to report 0 deaths due to the virus for today. That keeps the total number of deaths in Oregon at 127.
-
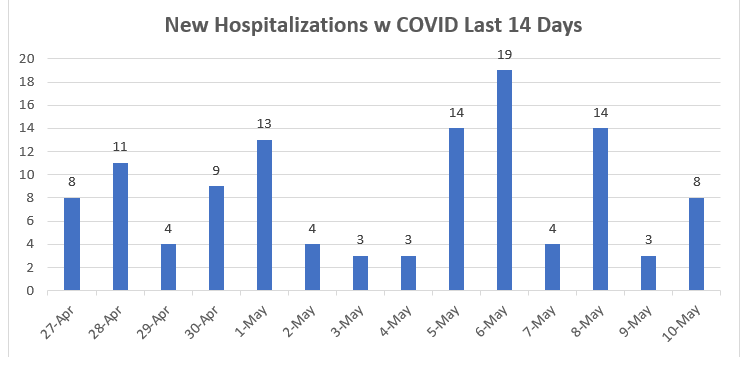
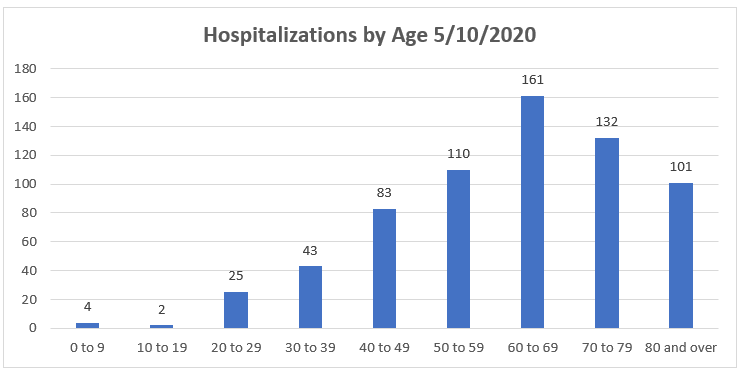
Hospitalized: The number of Oregonians who have been hospitalized with symptoms, and who have also tested positive for the disease, is now at 670. This is an increase of 8 from yesterday.
-
Presumptive Cases: OHA is now including “presumptive COVID-19 cases” in its daily reports, consistent with recently amended guidance from the Centers for Disease Control and Prevention. A presumptive case is someone who does not yet have a positive PCR test result but is showing symptoms and has had close contact with a confirmed case. If they later test positive by PCR, those will be recategorized as confirmed cases. Today the number of new presumptive cases is 8, with the total at 57.
-
Other Hospital Information:
- Patients Currently w COVID-19 Symptoms (who may or may not have received a positive test result yet): 164 (an increase of 25 from yesterday). Of those, 63 have already received a positive test back.
- Available ICU Beds: 230 (an increase of 11 from yesterday)
- Other Available Beds: 1,913 (an increase of 8 from yesterday)
- ICU Patients w COVID-19 Symptoms (who may or may not have received a positive test result yet): 45 (11 more than yesterday).
- COVID-19 Patients Currently on Ventilators: 22 (3 more than yesterday).
- Available Ventilators: 793 (6 fewer than yesterday).
-
Today’s National Numbers:
-
PPE:
- In the last 24 hours the Emergency Coordination Center has received another 500,000 surgical masks and 87,600 face shields.
-
Other Brief Updates:
Additional Counties Apply for Reopening
In yesterday’s newsletter, I listed the 15 counties that had applied for Phase One reopening and were listed as being under consideration on the Governor's COVID website as of 6pm. As of today’s writing, an additional five counties are under consideration. More than half of Oregon’s 36 counties are thus under consideration. The new counties are in boldface:
- Baker County
- Crook County
- Curry County
- Deschutes County
- Douglas County
- Gilliam County
- Grant County
- Harney County
- Hood River County
- Jackson County
- Jefferson County
- Josephine County
- Lake County
- Lane County
- Linn County
- Malheur County
- Sherman County
- Tillamook County
- Union County
- Wallowa County
Here’s a link to yesterday's newsletter, where I included the current metrics on each of the counties.
Interested in How the Portland Metro Region Is Doing?
In general, I think it would be fair to say that the Portland metro area is better poised to reopen than most of the rural areas in terms of access to testing, capacity for contact tracing and hospitalization, as well as access to Personal Protective Equipment. However, the infection rate for this area remains much higher than for the state as a whole, and the more concentrated population creates a higher risk.
Fortunately for us, Multnomah County has done a good job of providing updated information on the virus for the Portland Metro area. As I’ve mentioned in previous newsletters, if you go to the county COVID website, you’ll find the regional COVID-19 data dashboard, which allows you to search for information for the region as a whole, or by individual county within the region. I encourage you to check it out.
Input from Brian Wanty
As I’ve done for the last few weeks, I’m sending out an analysis of COVID in Oregon from Brian Wanty, a researcher from Eugene. Brian again compares Oregon’s efforts with New Zealand’s, to Oregon’s disadvantage. I would again argue that New Zealand’s geography and her early national mobilization makes this an unfair comparison, but agree that with the proper testing, tracing, and very careful easing (as they have done), we could see results that are more similar to theirs.
As you’ll see, he focuses on cases per million of population, which shows Oregon continuing to do much better than the nation as a whole, but seeing an increase in its rate. Idaho and Washington are seeing a decrease in their rates (with Idaho starting to do better than Oregon in its rate per million), while California and Nevada join Oregon in seeing an increase.
I should point out that the OHA believes that we should be less interested in the total number of positive test results, which could be a function of how much we’re testing, and more focused on the percentage of tests that come out positive. The more we’re testing, the lower the percentage should be (assuming that we’re testing fewer people showing clear symptoms).
Obviously, with the return of non-emergency medical procedures and next week’s further relaxations, we’ll need to keep a careful eye on both sets of numbers, along with the rate of new hospitalizations.
Additional Graphs:
More Numbers
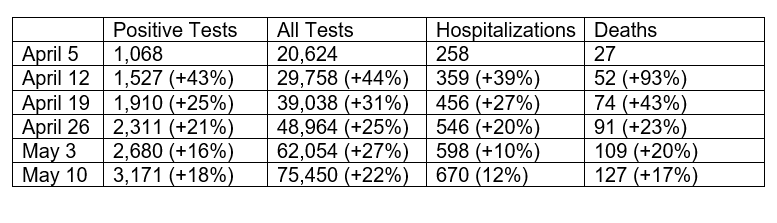
I’ve put together the following chart, showing the overall weekly sums of the Positive Tests (w All Tests added for perspective), Hospitalizations, and Deaths over the past five weeks. You’ll see that the weekly rates of increase in positive results and hospitalizations have risen slightly, while the death rate has declined slightly.
 Want to See Past Newsletters?
If there was COVID-related information in a past newsletter that you want to go back to, but find you’ve deleted it, you can always go to my legislative website (www.senatordembrow.com), click on “News and Information,” and you’ll find them all there. Also, if someone forwarded you this newsletter and you’d like to get it directly, you can sign up for it there.
AND FINALLY,
Here again are some resources that you will find useful:
If the above links are not providing you with answers to your questions or directing you to the help that you need, please consider me and my office to be a resource. We’ll do our best to assist you or steer you in the right direction.
Best,
 Senator Michael Dembrow
District 23
email: Sen.MichaelDembrow@oregonlegislature.gov
web: www.senatordembrow.com
phone: 503-986-1723
mail: 900 Court St NE, S-407, Salem, OR, 97301
|