|
|
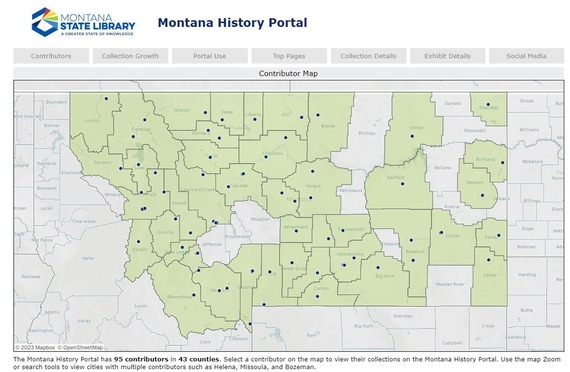
We often share new Collections, Exhibits, and Adventure Labs with our subscribers, but this week we want to share something completely different. We do a lot of work tracking our performance on the web and social media, and we are pleased to let you know that a lot of this data is available publicly. Our Tableau Dashboard has a wealth of statistics available to you. It has a map showing the counties where contributors have made content available. The map is shown below - if you know of institutions in the blank counties that would like to partner with us, please let us know!
The dashboard contains tons of information about our website performance, including monthly statistics and most popular collections and exhibits. There is also a section that shows the performance of our Facebook page. We hope you will take a look.
While we do quite a bit of work promoting the content on the History Portal, we also ask that you help us out. Is there a collection you think your patrons or students might be interested in? Is there a group in your area that might like to see some of our content? Do you or an institution you know have a collection of materials that would benefit from digitization and upload to the History Portal? Please share, promote, and help us get the word out!
|
|
The Montana History Portal provides weekly updates on new content as well as tips on how to successfully navigate the site through this Highlights newsletter. You can find back issues on the "Highlights" newsletter section of our website.
Library and museum staff members are encouraged to share these with patrons by linking our content and programs on your website and sharing through social media.
|
|
|
|