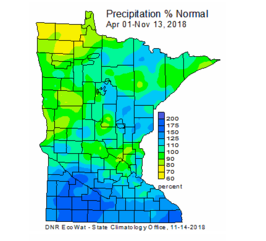
As Citizen Monitoring Program staff review and compile the 2018 Secchi water clarity data submitted by 1,300 citizen water monitors across the state, we want to express our gratitude to all of you who monitored this past year! As the ‘% Normal Precipitation map’ to the right displays, and many of you know too well, it was a wet year for many parts of the state. We understand that this can present challenges to completing regular monitoring duties, and truly appreciate your efforts to get out and track the health of your lakes and streams throughout the season!
We will let you know when 2018 online summary reports for lakes and streams are available.
As some of you are aware, last year we updated statistical methods used to detect changes in lake water clarity over time. We are now nearing completion of improvements to statistical methods for stream water clarity data, and we anticipate including these results in our 2018 reports. Thank you for your patience as we work to improve the ways in which we use the important data that you collect!
If you collected data last year, but haven’t submitted it, there is still time to send it to us! Please send data to:
Lake data: clmp.pca@state.mn.us
Stream data: csmp.pca@state.mn.us
Back to top
|
MPCA water monitoring crews were challenged by abnormally high rainfall patterns during the 2018 sampling season.
MPCA biologists divide into two monitoring teams – north and south – for monitoring fish and macroinvertebrates (bugs) in streams and rivers from mid-June through September each year. This year the north team focused on the Sauk and Little Fork River watersheds while the south team focused on the Redwood, Root, Le Sueur, Pomme de Terre, Mississippi River-Lake Pepin, and Snake River watersheds.
In the south, above average rainfall at the start of the sampling season hindered most work until July. In addition, more than 7 inches of rain fell in the Snake River watershed during a mid-July event while the Root River watershed received 5 inches of rain in a single August event.
The situation was similar in the north, where high river levels in the Little Fork River watershed prohibited sampling until mid- to late summer. From June to August, 12 inches of rain fell with 8 inches falling in June alone. Although specific large rain events avoided the Sauk River watershed, consistent rains throughout the summer kept the lower main stem of the Sauk River high throughout the watershed.
Due to the high flows across the state, several watersheds will have follow-up sampling performed in 2019.
In spite of the difficult stream flow conditions, MPCA crews were still able to collect good samples from a majority of locations:
- Snake River: Several fish species of concern, including lake sturgeon, gilt darter and northern brook lamprey.
- Middle Branch Root River near Chatfield: 30 fish species collected.
- Root and Mississippi River-Lake Pepin watersheds: Trout collected at 48 different stations.
- Cobb River near Beauford: 34 unique fish species collected at one visit.
- Sauk and Little Fork River watershed: 67 fish species collected, with several stations approaching 30 individual species.
Biological monitoring helps detect water quality impairments that other methods may miss or underestimate. It provides an effective tool for assessing water resource quality regardless of whether the impact is chemical, physical, or biological in nature.
Monitoring by the numbers
- North biological stations: 98 for fish and 112 for macroinvertebrates
- South biological stations: 120 for fish and 147 for macroinvertebrates
- Additional water chemistry data collected from: 114 lakes, 64 stream sections, 8 wells and 5 wild rice lakes
- Local partners and citizen volunteers also contributed to the effort by collecting water samples from lakes and streams in many watersheds
For more information
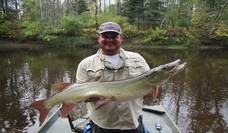
Photo above right: MPCA biologist sampled a 42-inch Muskellunge on the Sturgeon River in the Little Fork River watershed this past season. Back to top
|
We talk a lot about water quality trends here at the MPCA – and for good reason. Understanding if (and how) a lake or stream changes over time is critically important to protecting or restoring it. Quantifying how many lakes or streams have declining water quality helps us prioritize initiatives and use funding effectively. Knowing where declining or improving trends exist helps us understand how environmental pressures differ across the state.
Conducting a proper trend analysis isn’t a quick and easy process. Data need to be collected consistently, over many years, before enough uncertainty is removed to properly detect water quality changes over time. We have that in spades in the Citizen Lake and Stream Monitoring Program, however, CLMP and CSMP volunteers may still wonder exactly how their data fit into the trend analysis process. What if you only monitor your site for a couple of years and then have to drop out or retire from the program? What happens to data collected by volunteers thirty years ago?
The beauty of long-term data gathering initiatives like the CMP is that ALL data are used and are considered useful. Old data are just as important as new data because both are needed to understand how conditions change over time. The same person doesn’t have to monitor a lake or stream for twenty-five years to make a difference (although that is the gold standard and we LOVE our long-term monitors!). What is important is that SOMEONE is doing it. Maybe you monitor for 5 years, but find that life is getting too busy to continue - that’s okay and completely understandable. During those 5 years, you captured key moments in time that detail the health of that waterbody within the context of those years. You also prevented a data gap that could have interfered with a trend analysis determination. Finally, during those 5 years, you were the voice for the lake or stream. You were its advocate and history recorder, and you ensured that data were shared with decision makers on a statewide level.
What happens next, however, is of the upmost importance. Someone needs to take up the mantel after you to ensure that data collection continues and the historical record for the waterbody grows. Many people passionate about water quality fit within this continuum. You may pop in and out of the data collection timeline yourself, but what is great is that the timeline is bigger than you. And that, in a nutshell, is what citizen science is all about. Collective data collection for the collective good.
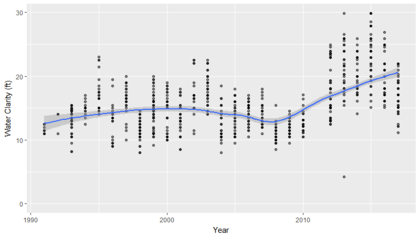
Visualize where you fit into in the graph above. Whether you are present for one year, 10 years or 30 years, know that you have contributed to the trend analysis process. Now consider going one step further. Can you recruit a neighbor, friend or family to share in the responsibility and be a part of the timeline? We can all play an important role in protecting Minnesota’s waters and one of the easiest ways to do it is to gather the data needed for long-term water quality trend analysis!
Back to top
|
Raising livestock is an important component of Minnesota’s agricultural industry. An estimated 24,000 livestock feedlots are registered in Minnesota, however, only 18,000 or so are actually in operation. The MPCA defines a feedlot as a “lot or building, or combination of lots and buildings, intended for the confined feeding, breeding, raising, or holding of animals and specifically designed as a confinement area in which manure may accumulate.”
With lakes and streams scattered across the state, it’s inevitable that many feedlots will be in close proximity to water. Feedlots can negatively impact water quality if not managed properly, particularly in regards to manure storage or manure land application practices. Because of these potential impacts to water resources, feedlots with 50 or more animal units, or 10 or more animal units within shoreland (i.e. less than 300 feet from a stream or river or less than 1,000 feet from a lake) need to be registered with the MPCA.
Livestock manure is a valuable resource. It has been estimated that the amount of manure generated by livestock in Minnesota would be equivalent to that of a human population of about 50 million. Land application removes livestock manure from feedlots and provides fertilizer to crops. For many feedlots in Minnesota the land application process begins with developing a manure management plan (MMP). MMPs help ensure that application rates do not exceed crop nutrient needs, and that setbacks from waters and drain tile intakes are observed.
A manure management plan has four main parts that include: 1). testing manure sources for nitrogen and phosphorus content, 2). identifying sensitive features, 3). identifying crop nutrient needs and 4). planning manure applications to meet these needs. While not all feedlots are required to develop an MMP, all land application of manure is required to follow two basic premises:
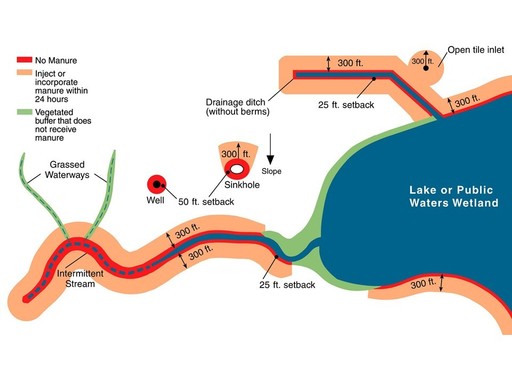
Applying nutrients according to U of M recommendations ensures that the most current research is used to provide sufficient, but not excessive, amounts of nitrogen to crops grown. Managing manure application in sensitive areas minimizes impacts to water features from potential runoff events. The most common technique used in sensitive areas are setbacks (areas where manure is not applied) near water features. The feedlot rule contains minimum setback distances based on the application technique used, since there is less risk of impacts from manure that is placed under the soil surface (incorporated/injected) than that which is left on the surface for an extended period of time. The most common setbacks are summarized in the graphic below. Additionally, all feedlots with more than 100 animal units are required to test the manure at least once every fours years to adequately quantify the amount of nutrients available in the manure. These practices help minimize concerns of manure nitrogen applications contributing to nitrate leaching to groundwater.
More information on manure management can be obtained from the MPCA website at: https://www.pca.state.mn.us/quick-links/land-application-manure
 Back to top

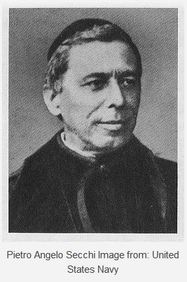
It's a handy, dandy instrument that's been used for over 150 years to monitor water clarity. Some disks are all white, some are black and white. Some have notches, some don't. But the real question is - what the heck do we call it?! There are about as many variations in pronouncing the name "Secchi" as there are lakes in the state! Thankfully, an old edition of LakeLine Magazine (published by the North American Lake Management Society) can help set the record straight. In one of the magazine's issues, the famous Bob Carlson, who created the Trophic State Index, incorrectly suggested that Secchi's name could be rhymed with "etch-e" not "ekki". He was quickly corrected by several readers who provided helpful details on the history of the pronunciation.
The Secchi disk is named after Fr. Pietro Angelo Secchi - a notable astrophysicist and scientific advisor to the Pope. Secchi was asked by Commander Cialdi, head of the Papal Navy, to measure the clarity of the Mediterranean Sea. He lowered the first disk from the papal yacht, I'immacolate Concezion, on April 20, 1865 (Carlson and Simpson, 1996).
In a follow up LakeLine article written by Carlson in 1997, he included one of the corrections he received from Rick Barbiero, one of his past students, and it goes a little something like this: "Unlike taxonomic names, which are neologisms in a dead language, Secchi is an Italian name, and there are rules of pronunciation in Italian. Almost all of Italian is pronounced phonetically, with a few exceptions. One of the most notable is that a 'c' followed by an 'i' is pronounced 'ch'. Thus ciao is pronounced 'chow', not kiao. For a 'c' to be pronounced as a 'k' if it's followed by an 'i' there must be an intervening 'h', which is kind of the reverse of what an English speaker might expect. Thus, Cialdi is pronounced "Chaldi" while Secchi is pronounced "Sekki" (or more correctly, "Saykki")."
So, there you have it folks, the definitive answer on how to pronounce Secchi! Get ready to lower those Saykki disks this summer! Back to top
|
The CLMP+ Program offers advanced monitoring opportunities for CLMP volunteers whose lakes are lacking the water chemistry data needed to properly asses its water quality. The program was developed to expand the basic CLMP to include temperature and dissolved oxygen profiles in addition to testing for alkalinity, chloride, chlorophyll, phosphorus and a few additional parameters.
Each year the CLMP is able to support a small number of lakes to participate in the CLMP+ Program and we are currently accepting applications for the summer 2019 season.
Please note - specific criteria need to be met for your lake to eligible to participate in CLMP+:
- It should be less than 500 acres in size (the MPCA will monitor lakes over 500 acres)
- It should be lacking recent (within the last 10 years) water chemistry data.
- It ideally would have a public access, public beach or public right of way
To find out if water chemistry data exists for your lake, or to find out if your lake has been recently assessed, we recommend using the DNR's Lake Finder website and following these instructions:
- Enter the name of your lake and choose the county it is located in (or type in the DNR Lake ID# if you know it)
- Choose your lake from the available list generated
- In the new window that appears choose "Water Quality" under "Reports" on the left hand side of the page
- You will then be redirected to the MPCA's page on your lake, listing all available data by lake monitoring station.
If you have any questions about CLMP+ or your lake's eligibility, contact Shannon at 651-757-2874 or shannon.martin@state.mn.us.
Back to top
|

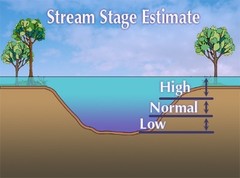
Have you ever wondered why we ask you to record an estimate of Stream Stage (L-N-H-Z or D) each time you monitor? In the above “Feeling trendy” article, we point out the importance of consistent data collection in allowing us to detect changes in water clarity over time. The ‘Stream Stage estimate’ ranking that you record each time you measure Secchi water clarity improves our ability to say whether stream water clarity is increasing, decreasing, or remaining the same over time.
Streams and rivers are, by definition, flowing waters.
|
Water level, or stage estimate, is a very important factor to include in our statistical analysis when trying to tease out the patterns, or trends, in water clarity over time at a given stream site. For example, steam flow (or stage) tends to go up after a large rain event. These events tend to wash more things into streams, and stir up sediment, decreasing clarity.
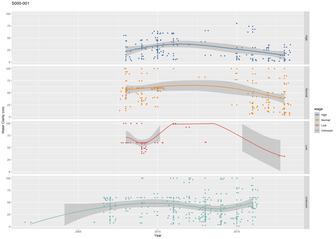
The bottom graph in the figure to the left shows instances when Secchi tube was recorded, but no Stage estimate. Many fewer Secchi tube readings were taken at recorded "Low" stage (red graph).
The more stage estimate data we have recorded, the more reliably we can predict if changes in water clarity are due to changes in streamflow, or if there is a consistent trend in water clarity over different flow regimes.
So, next time you are taking a Secchi tube reading and say to yourself - “I think I’ll skip recording a Stream Stage estimate this time” - think again! - and please take the time to record this important added piece of information. It is worth more than you think, and we WILL put it to use every year when we run our stream water clarity trend analysis.
Back to top
|
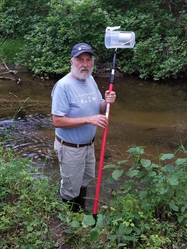
Have you ever seen small flies resembling mosquitoes walking on snow banks around trout streams in winter? If so, Len Ferrington (Professor, Department of Entomology, University of Minnesota) would appreciate your efforts to collect and record information about these flies. As larvae, pupae and adults, these flies, commonly called “non-biting midges,” are an important diet item of trout during winter in our trout streams in Minnesota. Len's research group has been discovering their life-cycle dynamics and importance to trout for more than a decade, and volunteer monitoring efforts can help expand the scope of this research program. For more information about reporting and collecting the flies, contact Len at ferri016@umn.edu.
If you want to learn more about past research, visit the web site of the Chironomidae Research Group at http://midge.cfans.umn.edu/research/winter-active-chironomidae and read this interesting article about his research at http://www.startribune.com/u-researchers-work-to-secure-the-future-of-trout/477825563/
Back to top
|

The Metropolitan Council Environmental Services (MCES) initiated a river monitoring program in the 1930s. MCES currently monitors more than 150 river miles in the metro area. To understand the historical changes in regional river water quality of the metro area, a comprehensive river assessment study was recently completed that examines the water quality of the Mississippi, Minnesota, and St. Croix Rivers over a 40-year period. You can find the complete river report, an executive summary and individual fact sheets on each of the three major rivers, as well as a regional overview at https://metrocouncil.org/river-assessment
Back to top
|
 This section of Transparency Times provides a way for MPCA Citizen Monitors to share stories and information. If you have something you would like to share with the Citizen Water Monitoring community, please email your idea or article submission (up to 300 words) to clmp.pca@state.mn.us (Lakes) or csmp.pca@state.mn.us (Streams).
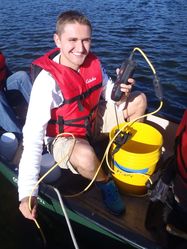
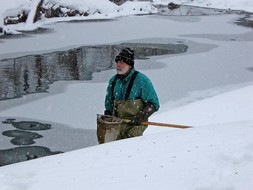
By CSMP Volunteer Ted Stevens
Howdy, my name is Ted Stevens. I am a stream monitor in Stearns County, Central Minnesota. I have been monitoring Johnson Creek and the Clearwater River in my area for a few years. Gradually, as I monitor the creeks and river, I have become a a better observer of all the insects, fish, and vegetation in the streams. I had noticed a change in nearby Plum Creek over the years, and mentioned it to Laurie Sovell. Laurie eventually had me contact my local Soil & Water District, and that group asked if I would like to participate in an on-going field study of Plum Creek. They eventually trained me in gathering stream and ditch samples for more in- depth bacterial and DNA analysis of those waters. I don't know what the end results will show, but it has been a great learning process for me. A real challenge to collect, and ship the samples which are time and temperature sensitive.
I hope to meet some fellow stream monitors at the annual meeting this year. The photo is of me at Plum Creek with my homemade water sample catcher. Back to top
|
By CLMP Volunteer Bryan Milbert
We wanted a pontoon for fishing & swimming with the kids, and my wife specified a 16' for ease of handling & the fact we are on a small lake. We ended up buying a 16' Forester Fish with a 9.9hp 2-stroke from a neighbor across the lake in 2017.
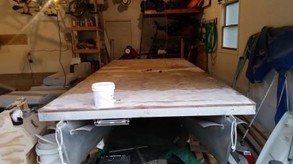
After using it during the summer of 2017, we found the 2-stoke engine was a pain - so I temporarily replaced it with a 55lb thrust Minn Kota tiller motor I was using on a rowboat. We liked the quiet, clean operation, but wanted more thrust & console steering + throttle. Since there were a few other improvements we wanted - I decided to tear it down to the plywood deck & build exactly what we want.
|
I designed it and built the vast majority myself. The main outsourced work was welding the aluminum solar panel frame. I built a custom console I had covered with matching grey Line-X (same material used to line pickup truck beds).
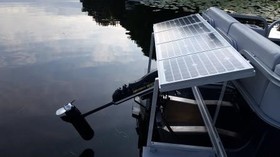
Propulsion & Power Specifications:
- Minn Kota E-Drive (2hp)
- (4) 12v deep cycle marine batteries wired in series to provide required 48v for motor
- (4) ACOPOWER 20w Mono Solar Panels wired in series to provide a max of 80w of charging @ 48v. This setup has been more than adequate for my use, but if a builder wants faster charge recovery, they can use larger panels. My pontoon is only 6' wide, a standard 8' wide pontoon can fit 50w panels with my mounting configuration for 200w of charging capacity
- Victron SmartSolar MPPT 150/35. This is the computer that manages charging of the batteries, which you can monitor via an app on your phone
- I use a step-down transformer to run the 12v accessories and LED lighting
Back to top
|
|