|
July, 2025
As a newsletter subscriber, we are giving you an opportunity to provide us with feedback on the WHAF Explorer Application. As we work to make improvements, we want to make sure we continue to meet your needs.
Please consider filling out the short survey when you see it in your inbox. Thank you from the WHAF Team!
In this issue...
If you use the WHAF, you know that we talk a lot about scale. We even suggest that you start your exploration with our 'Set Scale' tool in the WHAF Explorer map. On first glance, the word scale seems easy to explain; it is the way we measure of stuff - how big (acres) how tall (feet), how far away (miles); and how long ago (days, hours, minutes).
The WHAF Team often talks about matching the scale of the solution to the scale of the problem. This means we want to know the size of the source of the problem before deciding on the appropriate action to take. From local to landscape-wide, the WHAF Explorer can zoom in and out on catchment health scores and data layers to help reveal the extent of different challenges and opportunities as they relate to your location of interest.
Ecological Scale - How Interconnected?
In addition to thinking about how far, how big, how long ago; what about how interconnected? When we need to take action, we usually see one problem to solve; but the WHAF can help you look for additional connections. Whatever issue brings you to the WHAF, you can leave knowing more about how your location connects to other ecological challenges and opportunities.
Unpacking and detangling
This 'extra' exploring can seem overwhelming but you can use the WHAF Health Scores to put the risks and responses into some consistent groups. Let’s start with three ‘buckets’ that group different risks to our natural systems, and the ecological responses they might trigger.
First, let's think about direct actions we take that may change the watershed landscape.
Introduced Risks:
- Alter land cover
- Alter water storage and delivery
- Introduce contaminants
Then let’s think about some inherent risk factors that might make those alterations more impactful.
Inherent Risks:
- Erodible soils and steep topography
- Contamination susceptibility of groundwater
- Patterns in precipitation
And finally, let’s check to see how our waters are handling these risk factors by checking out the response we are seeing in our waterways. How well are streams and lakes handling what the landscape is sending downstream?
Ecological Responses:
- Impaired water quality
- Aquatic biology
Explore System Scale - Pomme de Terre River Watershed
Let's use the WHAF Explorer to take a look at some of the Risks and Responses in the Pomme de Terre River Watershed.
 The map on the left shows the major watershed (outlined in white) within the Minnesota River Basin. Zooming in, the map on the rightshows the Pomme de Terre River Watershed (masked) highlighting the land area that contributes surface water to the Pomme de Terre River, and to the town of Appleton (white circle) found near the mouth of the river.
Example: Introduced Risk
Extent of altered land cover is shown by catchment scale health scores for Impervious Cover (on the left) and Perennial Cover (on the right).
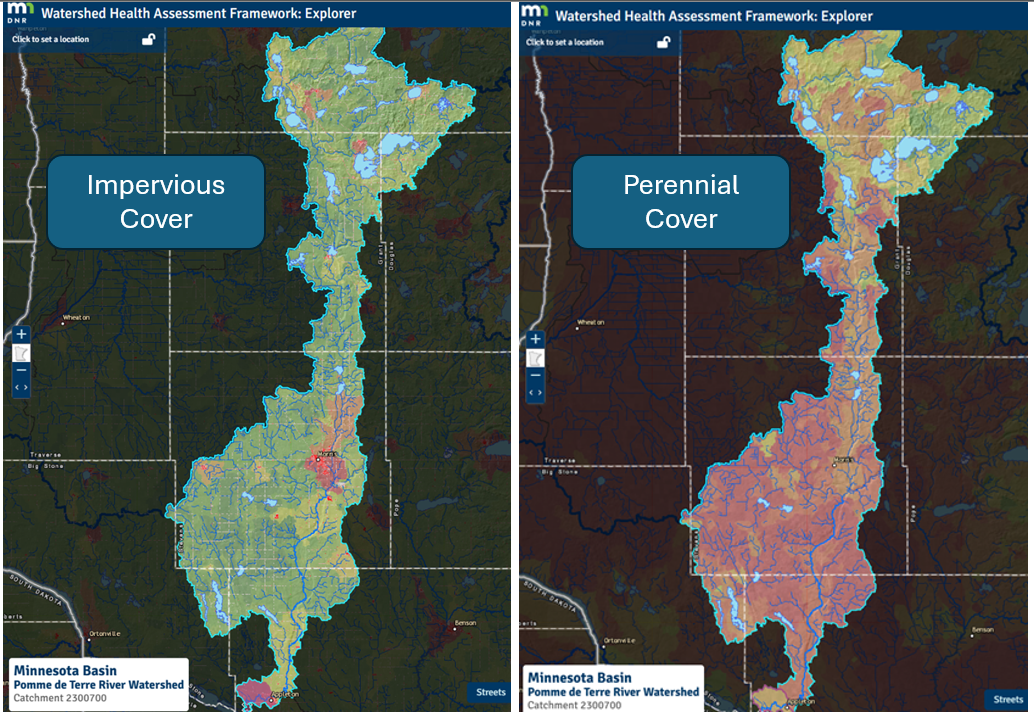 Open in WHAF Explorer: Impervious Cover and Perennial Cover.
Land Cover Take Away: Expected clusters of pavement and buildings are found near Morris and Appleton, but most of the watershed is less developed. Former prairie is converted to seasonal agriculture leaving little perennial vegetation; but further north, the lake dominated landscape holds more vegetation year round. Lack of permanent vegetation and expanding impervious surfaces can change the balance of water movement such as more surface water runoff, less groundwater recharge and more sediment and contaminants reaching lakes and rivers.
Extent of altered water storage and delivery is shown by the catchment scale health scores for Altered Watercourses (on the left) and for Aquatic Connectivity (on the right).
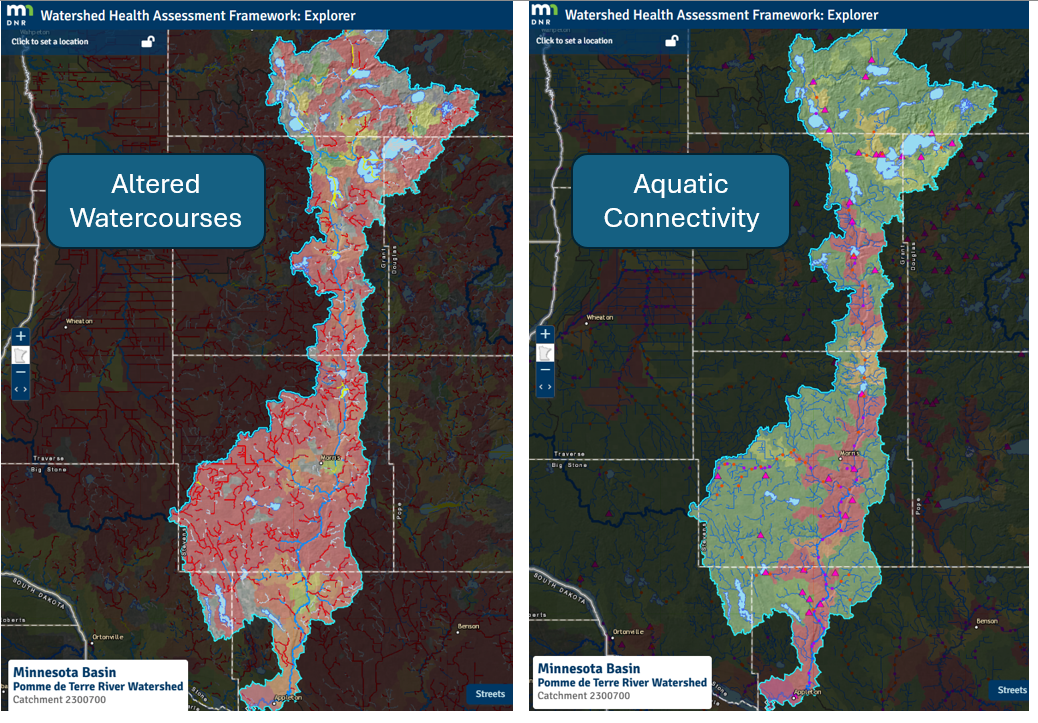 Open in WHAF Explorer: Altered Watercourses and Aquatic Connectivity.
Water Storage and Delivery Take Away: With nearly 90% of the stream miles upstream of Appleton straightened or altered, water infiltration is limited and the channelized systems are sending water and sediment more quickly downstream. Instream structures (dams, bridges and culverts) are impacting the river, particularly south of Barret; limiting the upstream/downstream movement of water, sediment, fish and other aquatic organisms.
Then let’s think about some natural risk factors that might make those alterations more impactful or risky.
Example: Inherent Risks
Risk of contaminating groundwater and measured change in annual precipitation are shown by catchment scale health scores and with related data.
 Open maps in WHAF Explorer: Contamination Susceptibility and Precipitation Departure
Groundwater Risk and Climate Departure Take Away: The watershed has fairly low susceptibility for surface contaminants to move toward groundwater, but just north of the major watershed boundary are riskier areas that could have an impact within this watershed. Climate departure data shows rainfall has increased everywhere, with the greatest increase (2.3 inches) in the southern part of the watershed. With more precipitation, the altered landcover and loss of water storage will be more impactful, particularly during storms where rainfall intensity is also higher.
And finally, let’s check to see how our waters are handling these risk factors by checking on the response of our waterways. How well are streams and lakes handling what the landscape is sending downstream?
Example: Ecological Responses
Water Quality Impairments were found in some of the tested streams and lakes. Catchment health scores for Aquatic Life Assessments scores the percent of streams that met that aquatic life standard.
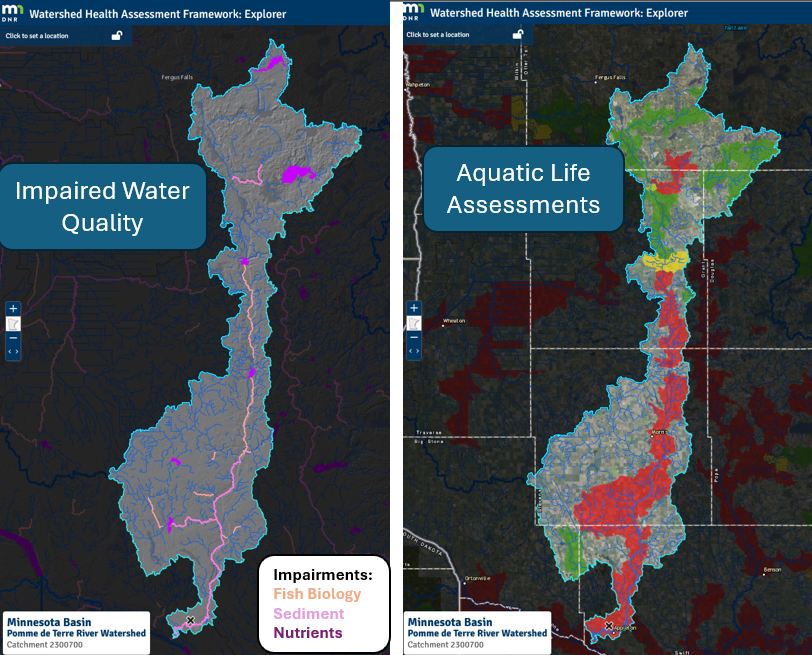
Open Maps in the WHAF Explorer: Impaired Water Quality and Aquatic Life Assessments
Ecological Response Take Away: The system is unable to handle some of the risks within the watershed. There are lakes impaired by nutrients and streams impaired by sediment and that have degraded aquatic communities. Many stream miles failed to meet the water quality standard for aquatic life, but waterbodies in the upper watershed have retained better biotic health.
Next Steps for Scaling your Solution
By examining health at the system scale for the Pomme de Terre River Watershed, we learned quite a bit. There are extensive alterations to water storage and delivery, and to land cover. There are places with unhealthy water quality and degraded aquatic communities. There are also places that are functioning well with the potential to expand and connect new areas to those with better health.
It's complex; ecological systems in Minnesota have been altered over long time frames and to different levels of intensity. When our waterways send us signals that their health is declining, we can use that information to think differently about our next steps.
Questions to guide your next exploration of scale:
Spatial Scale
-
Is my action addressing the source of a problem, or a symptom?
- Set spatial boundaries that consider ecological processes
-
Will my action provide benefits beyond its original boundaries?
- Look for opportunities to connect to places that are functioning well
Temporal Scale
-
Does my action consider the timeline needed to provide positive improvement?
- Acknowledge that long term benefit may take longer to emerge and measure
-
Will that improvement extend into the future, or need intervention to continue?
- Compare actions on an even playing field; compare replacement or maintenance costs to self-sustaining functions
System Scale
-
Does my action address multiple ecological challenges?
- Look across the 5 ecological components for additional influences that might enhance or undermine an action or investment.
-
Does my action restore ecological systems to build better function?
- Consider whether an action is self-sustaining, allows ecological function to improve and provide on-going improvements in watershed health.
Asking these questions during your exploration will help you include spatial, temporal and system scale as you consider actions that will improve watershed health.
There is another interesting chapter in the Pomme de Terre story. Much action has already been taken to begin the work of restoring ecological function. While our overview (above) revealed a decline in aquatic life, a deeper dive is needed to understand the unique drivers and how a system can be re-connected so it can again provide access to suitable habitat.
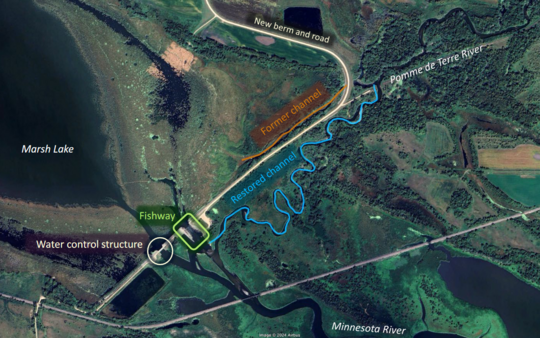
What actions have been implemented on the Pomme de Terre river that consider the spatial, temporal and system scale of these risks and responses? Here's an example of extensive restoration work near Appleton, Minnesota. The work spans nearly two decades following the failure of the Millpond Dam in 1997. The dam site was modified into a riffle, restoring the stream that had been buried by the reservoir; resulting in many river miles of the historic fishery being reconnected. Building on the success of that reconnection; work has now been completed downstream at the mouth of the river to allow fish passage, connect riverine habitat, and recolonize mussels in an abandoned channel; once again connecting the historic Pomme de Terre to the Minnesota River.
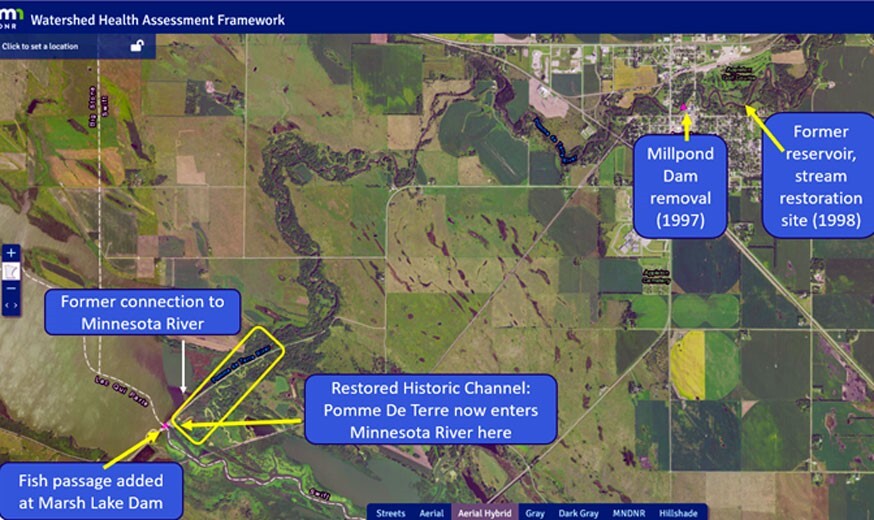
Zooming in on the restoration work completed at the confluence of the Pomme de Terre River and the Minnesota River at Marsh Lake.
Today, work continues further upstream on the Pomme de Terre RIver to remove more barriers and reconnect the fish communities and the mussel communities that depend on them.
Read this fascinating story of removing barriers, restoring streams and reconnecting fish and mussel communities: River Stories: Reconnecting the lower Pomme de Terre River
Investing in restorative actions lets the system reinvent itself to a more natural flow regime; water levels fluctuate, meander bends return, habitats are reconnected and aquatic communities begin to recover. Expanding access to the floodplain will reduce the erosive energy of floods and allow deposition that reduces sediment and contaminants downstream.
The double bonus? When they are well-designed, these ‘restorative’ actions do most of the future work for us; they lead the way to a more sustainable and resilient condition that requires less intervention and less investment to maintain. They also provide additional resilience that helps buffer against less predictable future climate patterns and other shifting conditions.
|