 15 October, 2024
What's in a Name?
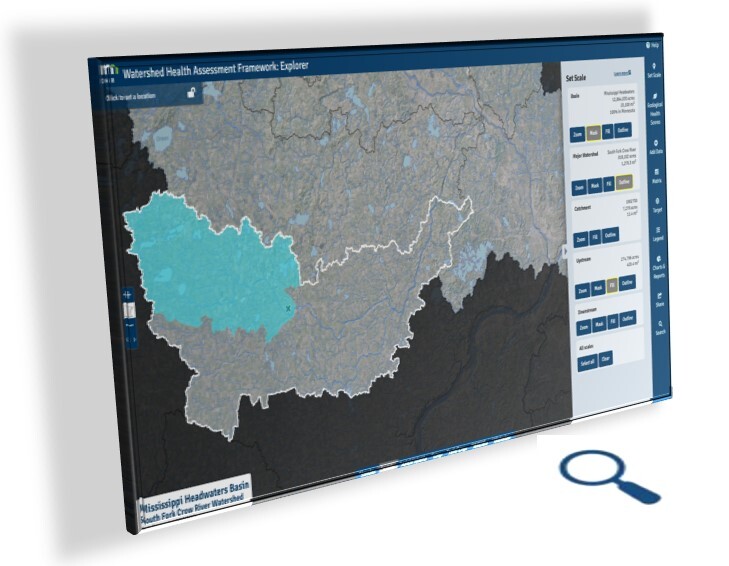
The WHAF Team has been busy updating our website. While most changes have been subtle and behind the scenes, you may notice that our flagship application, the WHAF Watershed Map is now the WHAF: Explorer.
Why 'Explorer'? Because the Watershed Map has become much more than a tool to view data and health scores for a specific watershed. The new name emphasizes that the WHAF Explorer is designed to help you look over the horizon to consider other places and other timeframes. This expanded vision helps reveal unexpected connections in novel situations; and that's the definition of being an explorer!
 |
|
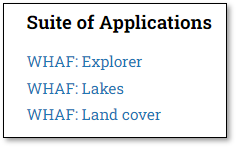
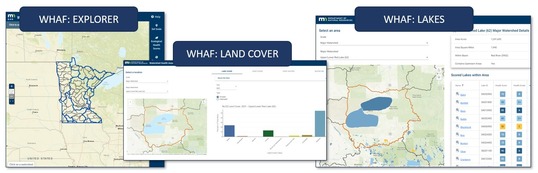
Check out the new navigation from our WHAF website. The menu now highlights our 'Suite of Applications' to let you more easily find and switch between our three different applications. |
 Each application focuses on summarizing data in ways that give more insight into Minnesota's natural resource systems.
-
Explorer: Understand watershed boundaries, check health scores, and display more than 200 data layers.
-
Land Cover: Summarize land cover, crop cover and cropping history at different scales. Explore charts of changes in water use and available water over time.
-
Lakes: Compare lake health scores across a county or watershed, and then dive into specifics about the health of each lake.
These applications work together and can help paint a robust picture of interactions that have an impact on ecological health in your neighborhood and across the state.
Let's walk through an example of an exploration that bridges the information from these three applications. At the same time, I'll share some recent data updates that add to our watershed understanding.
In the WHAF: Explorer, the map was clicked to set my location near Winona, Minnesota. I selected to mask the boundary of the major watershed, and I added a new data layer that shows 'delisted streams'. Link to map.
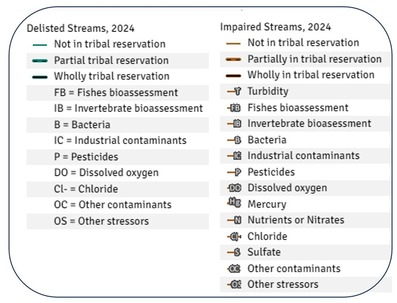
NOTE: Data layers for delisted streams and lakes are a recent addition to WHAF water quality data. These are the water resources that now meet water quality standards for a standard that they previously did not meet.
The green lines are streams that have been delisted for a water quality impairment and it shows some good news in the Winona area.
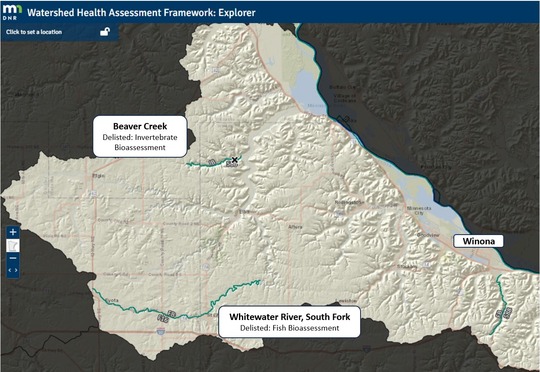 I'd like to dig a little deeper to understand the context for this change from an impaired stream to an unimpaired stream. One additional piece of information to include is the data layer that shows all of the remaining stream impairments. Just because a stream now meets the standard for one impairment, it does not necessarily meet all water quality standards.
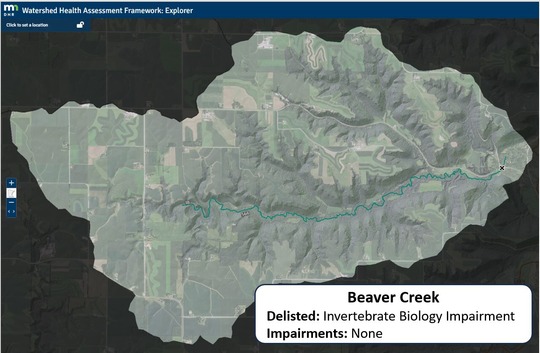
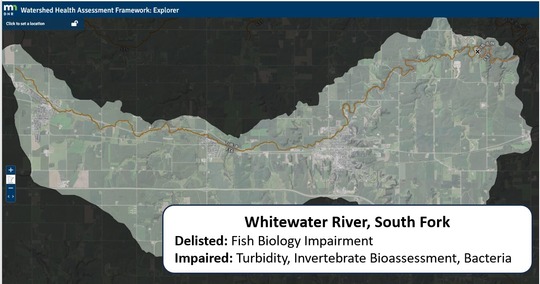
In the maps below, the impaired streams layer was added and reveals a difference between Beaver Creek and the Whitewater River, South Fork.
 |
|
NOTE: This detailed legend helps explain the labels that are shown in each map. Use the 'Add Data' on/off switch to display each layer and determine which impairments were delisted, and which impairments remain. |
Open the map below for Beaver Creek. The Impaired Streams, 2024 data layer no longer shows up for Beaver Creek. The detailed labels reveal that Beaver Creek was delisted for 'IB' and no longer has any listed impairments, so it now meets water quality standards. That's great news for this important trout stream.
In contrast, the map below of the Whitewater River South Fork shows that it will need further work to meet three additional standards where it continues to falls short: turbidity, aquatic invertebrates and bacteria.
 Now I'm curious to know what kind of land cover is in the watershed upstream of the South Fork. This could help me think about ways to address those other water quality problems. With your South Fork map open, use the Charts and Reports panel to open the Land Cover Application at the upstream scale.
NOTE: This is another important data update. The WHAF Land Cover data was recently updated to reflect the most recent available data from the National Land Cover Dataset (NLCD 2021).
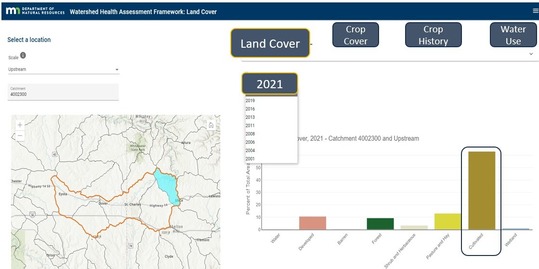 This chart quickly gives a snapshot of the landcover for the surface area influencing the South Branch.
- Current landscape has cultivated lands covering 60% of the landscape, while developed, forested and pasture cover 10-15% each.
- Comparing 2021 to the 2001, forested cover stayed the same, developed lands increased by ~0.5%, cultivated land increased by ~1.5%, pasture/hay decreased by ~1.5%,
To dig deeper, you may want to check the tabs at the top of the page; Crop Cover, Crop History and Water Use. This would give a more detailed view of trends in cultivated land cover and water appropriation.
As a final check on the water quality concerns in this area near Winona, I decided to zoom out a bit and see if I was missing any important lake related information. While this isn't typical Minnesota lake country, I did see that a couple of lakes have WHAF Lake Health Scores and decided to check those out too. I opened Charts and Reports panel and hit the button to Launch Lakes at the Major Watershed Scale.
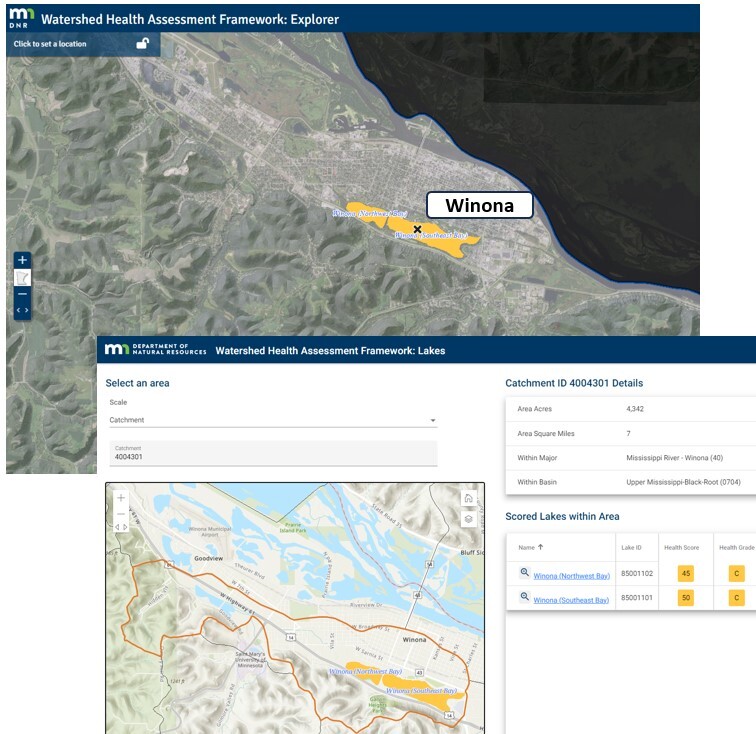 Opening WHAF: Lakes for the Winona Watershed showed these two scored lakes. There is much to dig into here about Lake Health, so I'll mention just a couple of take-aways.
- Both lakes are impaired for phosphorus level
- The Southeast Bay does meet water clarity goals
- Both lakes are likely to be more impacted by watershed conditions and surface water rather than groundwater
- Both lakes are likely to provide a great return on investment for actions taken to improve the quality of these locally important water resources.
That's a quick desktop WHAF: Explorer experience! I hope you find new ways to look over the horizon and consider the unique connections that make each of Minnesota's watersheds a place worth exploring and understanding.
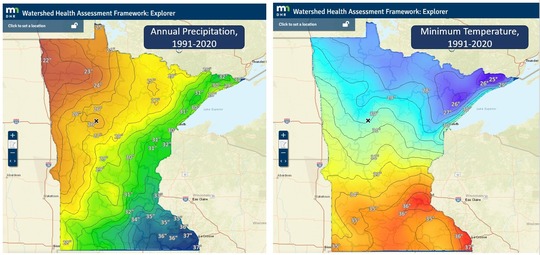 A climate 'normal' is an average calculated using 30 years of data; these two maps show the 'normal' for annual precipitation and minimum temperature in Minnesota using observed data from 1991-2020.
There are several new climate related data layers available in the WHAF Explorer. The two maps above show average values for annual precipitation and minimum temperature using a 30-year time span. This 30-year average is also referred to as a 'Climate Normal'. This is done to avoid drawing broad conclusions about short-term variability (e.g., comparing one year to the next) in favor of representing average climate conditions that occurred over that longer window of time. The WHAF Explorer now delivers updated Climate Normals for Annual Precipitation; and Annual and Seasonal Temperature based on data from 1991-2020.
The WHAF Team also compared the new Climate Normals to the entire record of historic values. This is referred to as a climate 'departure'; how different is the current climate from the past climate? Examples below are the Precipitation Departure and Minimum Temperature Departure comparing data from 1991-2020 to data from 1895-2020.
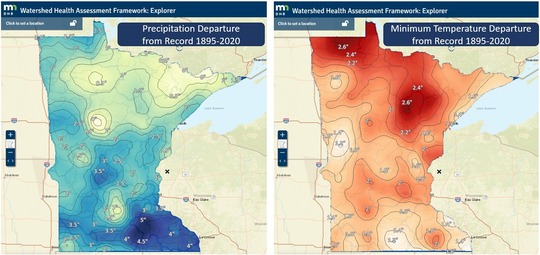 Precipitation departure map shows an increase in precipitation particularly noticeable in southeastern Minnesota. The minimum temperatures (winter lows) are showing the most change with the greatest increase occurring in northern Minnesota.
Climate Data Details: The source data used to create these maps is from the NOAA Global Historic Climate Network. The monthly values are summarized at each of the 14,522 gridded observation points for each climate attribute and converted into a interpolated surface to generate rasters covering the state with a spatial resolution of 1km grid cells.
In the absence of a single national data standard for measuring climate over broad spatial scales, there are other equally reputable data sources that can be used to calculate temperature and precipitation normals for Minnesota such as MNgage and Prism.
While different climate data sources may be used to meet climate modeling and analysis needs, the important story they are telling is consistent. Minnesota is getting warmer, most noticeably our winter nighttime lows in our northern regions; and we are getting wetter particularly in the southeastern part of the state.
The updated Climate Normal and Climate Departure data is available to view in our WHAF Explorer. The data is also available for download from Minnesota's Geospatial Commons for use by others. This updated information provides another tool to help our partners adapt to managing resources in response to changing climate conditions.
Shared Data, Shared Learning
By working with our partner agencies, we are delivering more data that helps us all work toward innovative solutions that move the needle toward healthier watersheds.
Thank you to all of our partners, and thanks to all the Minnesotans that care about healthy watersheds!
|