 25 March, 2024
What's New in 2024?
The WHAF Team has been busy updating important information to keep us current with new data and new learning about the health of Minnesota's watersheds. Check out each section below to find information that has been added or updated, and to learn why the data is important for understanding watershed health.
To explore new data:
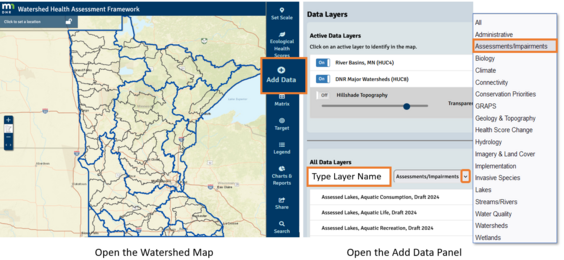
- Open the WHAF Watershed Map.
- Open the Add Data Panel.
- Select data by category from the drop down menu.
- Or type to filter the list by layer name or topic.
Open the Watershed Map Guide for more detail on navigating the map and adding data.
In partnership with Minnesota Department of Health (MDH), the WHAF Watershed Map has been delivering groundwater data to the general public and agency partners. Easy access to this information supports the inclusion of groundwater concerns and drinking water protections during watershed planning efforts in Minnesota.
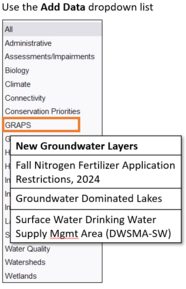
This information is also used to create the Groundwater Restoration and Protection Strategies (GRAPS) Reports for Minnesota's major watersheds. For those interested in reviewing the MDH data in the WHAF Map, you can filter the data list using the term 'GRAPS'. You can either select GRAPS from the dropdown list or type the term in the search bar. This provides a list of the groundwater and drinking water data used to create those reports. An example of the newest additions to that list are shown in the map below.
|
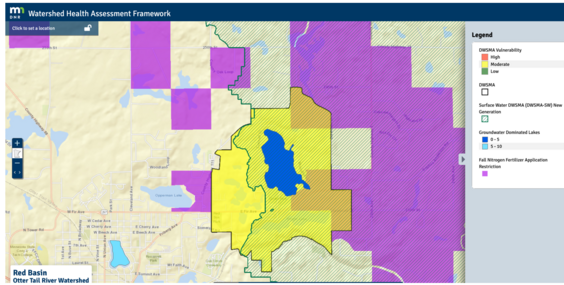 Drinking water supply area near Fergus Falls, Minnesota
Open this map in your browser to explore surface water and groundwater concerns near Fergus Falls, MN. An area identified by MDH as important for protecting drinking water supplies is referred to as a Drinking Water Supply Management Area (DWSMA). In this case, the DWSMA encompasses the land area needed to protect the Ottertail River as a drinking water source for Fergus Falls. The DWSMA-SW is shown with the green hashed symbol in the map.
Within this area, the purple grid shows land that has restrictions on fall nitrogen fertilizer application. Also within this area, Hoot Lake (shown in royal blue) is a groundwater dominated lake. Together these new data can help discussions of the many risks and pathways that connect land activities to groundwater and surface water quality.
Interested in learning more? Check out the MDH website for more detail on Minnesota's GRAPS reports.

The WHAF Watershed Map recently updated the data related to water quality assessments and impaired waters. Delivering this data is a coordinated effort with the Minnesota Pollution Control Agency (MPCA).
Determining whether our lakes and streams meet water quality standards is work done by MPCA staff. When a water body falls short of the set standard, the status is listed as 'impaired'. The most recent list of water quality impairments and assessments is now available in the WHAF. This newest list (draft, 2024) has been sent by MPCA to EPA for approval. When the final judgements of impaired and assessed waters are available from EPA, the layers will be updated and the 'draft' designation removed from the layer names.
Exploring Minnesota's Impaired Waters
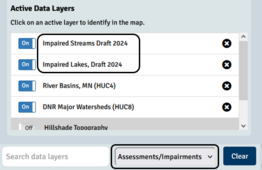
From the Add Data panel, open the drop down menu and choose Assessments/Impairments.
This will filter the All Data Layers list to show the layers with different types of impairment information.
To get started, select Impaired Lakes Draft 2024 and Impaired Streams Draft 2024. The layers will be added to your Active Data Layers.
These layers are labeled with the impairment types that are present for each lake and each stream reach that has been evaluated. This makes these layers especially helpful for evaluating many impairments with a single map view.
Open the map below to view these layers for the area near Northfield. Open the Legend to see what the symbols mean. Pan and zoom in the map to look for different impairment types that might be of interest.
|
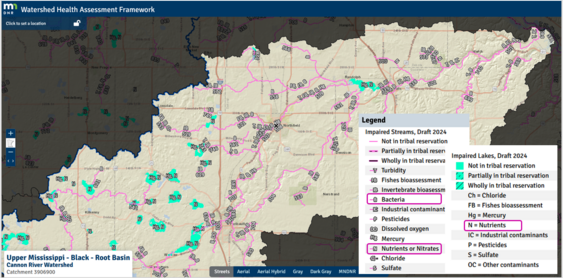 Lakes and streams labeled with their water quality impairments
The next step is to add a couple specific impairment types to see where they are located. As an example, the map below shows only impairments for:
- nutrients and nitrates in streams
- bacteria in streams.
- nutrients in lakes
This more focused view lets you see the location of the lakes impaired for high levels nutrients and streams impaired for high levels of bacteria and nutrients.
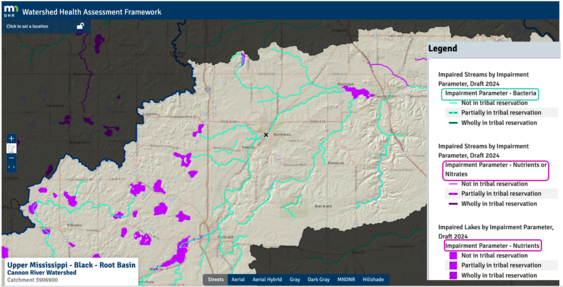 Lakes with nutrient impairments, streams with nutrient or bacteria impairments
The MPCA website has information if you would like to learn more about about Minnesota's list of impaired waters.
Assessed Uses for Water Bodies
Minnesota water quality standards protect lakes and streams by defining how much of a pollutant such as bacteria or nutrients can be in the water and allow it to still provide beneficial uses.
One of the most important beneficial uses protected by Minnesota rule and the Federal Clean Water Act is aquatic life (Class 2 – Aquatic life and recreation).
- It protects ecosystems, habitats, and aquatic biota including fish, insects, mollusks, crustaceans, plans, microscopic organisms, and all other aquatic-dependent organisms.
- It protects recreational uses such as swimming, fishing, hunting, and boating.
- It is assigned to nearly every waterbody in the state. (from MPCA website)
In the map below, the water bodies in pink were determined to 'not support' aquatic recreation. Digging deeper into the relationship between high levels of nutrients (e.g. phosphorus) in impaired lakes, and high levels of nutrients and bacteria (e.g. e.coli) in impaired streams can help WHAF users discuss actions to improve water quality in ways that also enhance recreational opportunities in our lakes and streams.
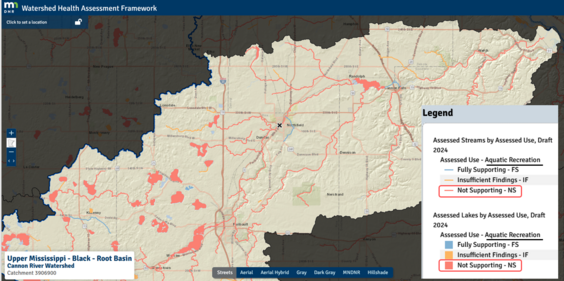 Lakes and Streams not supporting aquatic recreation are shown in pink
Interested in the more detail around water quality and beneficial use assessments? Visit the MPCA website for more detailed information.

In our last newsletter, we highlighted our newest application; WHAF for Lakes. This is a reminder that WHAF for Lakes and the Watershed Map can be used together to leverage the strength of both.
You can use WHAF for Lakes to:
- Compare health for a list of lakes.
- Explore lake health and health scores for an individual lake.
- Understand 'what the data means' to inform stewardship actions.
- And link directly to the WHAF Watershed Map.
You can use the Watershed Map to:
- Add Lake Health scores to the map.
- View upstream area and downstream boundaries for your lake.
- Add watershed health scores and view tons more data.
- Save and share your map views.
|
Want to give it a try? You can open this detail page for Bay Lake. Check out the lake health scores and basic lake details. Look for the link from the lower right corner of the map. Click to open Bay Lake in the WHAF Watershed Map. In this example map, the Lake Health Scores and watershed boundaries have already been added to the watershed map.
Shared Data, Shared Learning
By working with our partner agencies, we are delivering more data that helps us all work toward innovative solutions that move the needle toward healthier watersheds.
Thank you to all of our partners, and thanks to all the Minnesotans that care about healthy watersheds!
|