The City's Housing Market
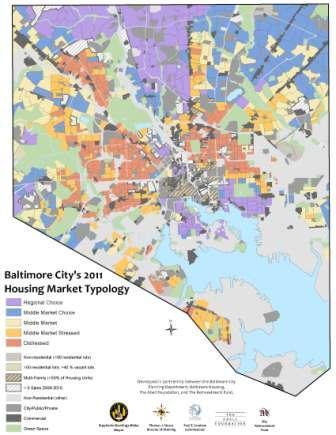
2011 Baltimore City Housing Typology
The Baltimore City Department of Planning. in partnership with the Department of Housing and Community Development (HCD), are pleased to announce the release of the 2011 Baltimore City Housing Market Typology.
In 2011, the Planning Department and HCD collaborated with The Reinvestment Fund (TRF) to produce a three-year update of the 2008 Baltimore Housing Market Typology (HMT), thanks to funding from the Abell Foundation.
The first market typology was completed in 2005. To complete the update, a Task Force was formed to guide and inform the process. The Task Force, with representation from non-profit organizations, foundations and academic institutions, as well as private entities such as banks and private developers, met regularly over a period of eight months to discuss the analysis of variables, market types and final results.
The Typology will assist city government, local foundations and non-profits to understand local market strengths and to appropriately match neighborhood strategies to market conditions, for the best use of public and private resources. In addition, the typology will inform neighborhood level planning efforts and provide residents with an understanding of the local housing market conditions in their communities.
 Housing Typology Process
The 2011 typology was developed through the use of a statistical process called cluster analysis. This procedure creates homogenous groupings to identify areas that share a common collection of characteristics. Based on input from the Task Force, ten variables defining the housing market were aggregated by census block group. In the analysis, the following variables were included: median sales price, coefficient of variance for sales price, subsidized rental stock, permits greater than $50,000, vacant lots, vacant housing units, foreclosure filings, ratio of commercial to residential area, owner-occupied housing units, and housing density. The cluster analysis of the variables produced five market categories. The ten variables included in the analysis were not weighted, therefore, the market types were sorted based on median sales price, from the highest value market to the lowest.
Next, the cluster analysis was mapped, and with TRF, we toured Baltimore’s neighborhoods to test how well the statistical representation resulting from the typology reflects how things appear in reality.
Based on the cluster analysis and field observations, the Task Force categorized the City’s housing market into five market types, as shown in the 2011 Baltimore City Housing Market Typology map: Regional Choice, Middle Market Choice, Middle Market, Middle Market Stressed, and Distressed.
Additional information, including a copy of the map, with complementary market indicator (or variable) averages for each market type will be available on the Baltimore City Department of Planning’s website, and on the Open Baltimore website in February 2012. Full color poster sized copies of the typology map will be available from the Planning Department at a cost of $50 each.
(The small print: Due to a high level of interest in this project, please allow at least 2 weeks for map requests to allow time for printing and processing.)
Housing Market Descriptions:
Regional Choice
 |
|
Neighborhoods in the Regional Choice market category, such as Otterbein, Bellona Gittings, Evergreen, Brewers Hill, Locust Point, and Ridgley’s Delight represent competitive housing markets with high owner-occupancy rates and high property values in comparison to all other market types. Foreclosure, vacancy and abandonment rates are low. Substantial market interventions are not necessary in the Regional Choice market. Basic municipal services such as street maintenance are essential to maintaining these markets. |
Middle Market Choice
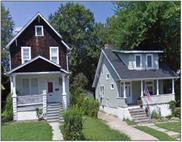
Neighborhoods in the Middle Market Choice category, such as Belvedere, Original Northwood, Glen Oaks, Westfield, and Hunting Ridge, have housing prices above the city’s average with strong ownership rates, and low vacancies, but with slightly increased foreclosure rates. Modest incentives and strong neighborhood marketing should keep these communities healthy, with the potential for growth. |
|
 |
Middle Market
 |
|
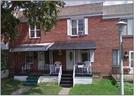
Neighborhoods in the Middle Market category such as Old Goucher, Stonewood, and Kenilworth, have median sales values of $91,000 (above the City’s average of $65,000) as well as high homeownership rates. These markets experienced higher foreclosure rates when compared to higher value markets, with slight population loss. Neighborhood stabilization and aggressive marketing of vacant houses should be considered in this category. Diligent housing code enforcement is also essential to maintain the existing housing stock. |
Middle Market Stressed
Neighborhoods in this category, such as Hollins Market, Wilson Park, and Evergreen Lawn have slightly lower home sale values than the City’s average, and have not shown significant sales price appreciation. Vacancies and foreclosure rates are high, and the rate of population loss has increased in this market type, according to the 2010 Census data. Based on these market conditions, intervention strategies should support homeowners who may be facing economic hardships due to the national economy. |
|
 |
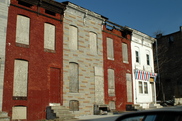
Distressed Market
 |
|
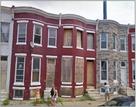
These neighborhoods, which include Madison-Eastend, Gay Street, Harlem Park, and Milton-Montford, have experienced significant deterioration of the housing stock. This market category contains the highest vacancy rates and the lowest homeownership rates, compared to the other market types. It also has experienced some of the most substantial population losses in the City during the past decade. Comprehensive housing market inventions should be targeted in this market category, including site assembly, tax increment financing, and concentrated demolitions to create potential for greater public safety and new green amenities. |

|