 May Indiana
Employment Report
Labor Force Participation at Highest Point Since 2009
INDIANAPOLIS (June 17, 2016) – Nearly 13,000 more Hoosiers found employment in May 2016 than the
previous month while the number of unemployed dropped by more than 5,000.
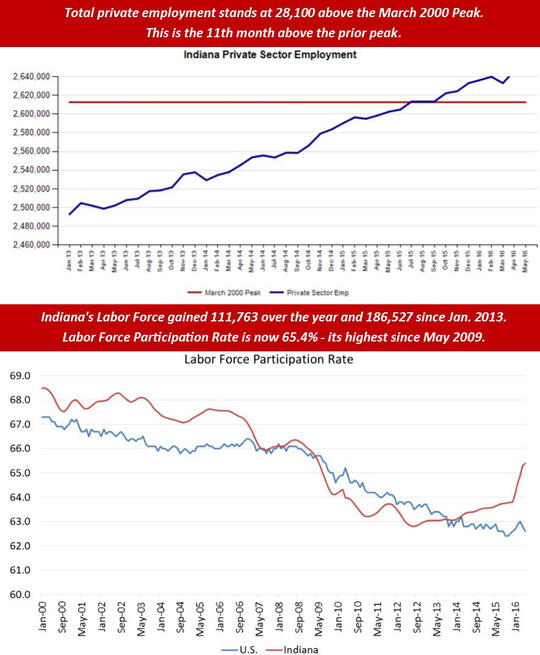
This positive ratio enabled Indiana’s labor force, a measure of Hoosiers
employed or seeking employment, to continue its positive momentum and bring
total labor force growth to more than 186,000 since January 2013.
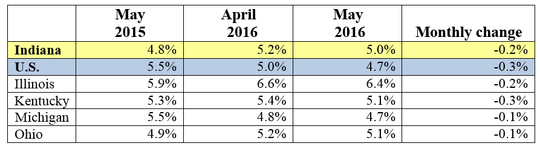
The corresponding effect of growth in employment along with a
decline in unemployment lowered Indiana’s seasonally adjusted unemployment rate
to 5.0 percent. The unemployment rate, a U.S. Bureau of Labor Statistics (BLS)
indicator that reflects the number of unemployed people as a percentage of the
labor force, declined by 0.2 percent over the previous month. Additionally, the
state’s labor force participation rate increased 0.1 percent in May while the
nation’s rate decreased 0.2 percent for the second consecutive month. Indiana’s
participation rate now stands at nearly three percent above the national
average (65.4 percent vs. 62.6 percent).
“Indiana’s labor force participation rate is at the highest
point since 2009 and continues to outpace the national average,” said Steven J.
Braun, Commissioner of the Indiana Department of Workforce Development.
“Indiana experienced positive gains in employment accompanied by a decrease in
unemployment, which suggests that many Hoosier jobseekers, including those
joining the workforce for the first time in May, found success in securing
gainful employment.”
Commissioner Braun also noted that Indiana’s private sector
employment growth since July 2009, the low point of employment, has surpassed
the nation (13.7 percent vs. 12.6 percent). Additionally, he referenced that
initial unemployment insurance claims for the first 23 weeks of 2016 are at
their lowest point since 1987.
Employment by Sector
The highest levels of growth
occurred in the Trade, Transportation and Utilities (3,700) and Financial
Activities (300) sectors. Gains
were offset with losses in Professional & Business Services (-3,400), Leisure and Hospitality (-2,100) Manufacturing (-2,100), and Private
Education & Health Services (-1,100) sectors. Over the past three years, Indiana’s private
sector has grown by more than 147,000 jobs.
Midwest Unemployment Rates
EDITOR’S
NOTES:
Data are sourced from May Current
Employment Statistics, Local Area Unemployment Statistics – U.S. Bureau of
Labor Statistics
May employment data for Indiana Counties, Cities, and MSA’s
will be available Monday, June 20, 2016 at 12 p.m. pending U.S. Bureau of Labor
Statistics validation.
-30-
For additional information, contact:
| 

