COVID-19 Alaska Weekly Case Update: Sept. 6 -12, 2020
Alaska Department of Health sent this bulletin at 09/17/2020 06:49 AM AKDT
September 6-12, 2020
Note: DHSS has revised the format of the weekly case update to be more concise, readable and to better highlight trends in data. The most up-to-date data, including data for individual communities with a population of >1000, are always available in full on the Alaska Coronavirus Response Hub.
Case trends and predictions
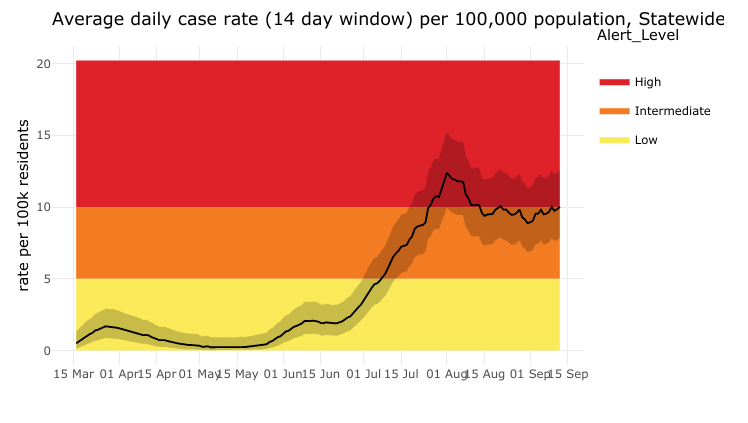
- Overall, new cases in Alaska are increasing. The daily state case rate as of September 12, 2020 is 8.7 cases per 100,000 people averaged over the last 14 days. This is up from 7.9 last week and 7.0 the week before, so the state alert level for this past week remained at intermediate (orange).
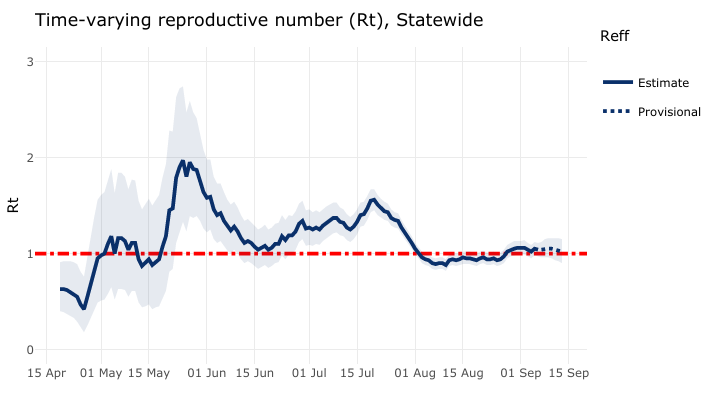
- The reproductive number, a measure of contagion, has increased to 1.02 and is projected to continue to increase slightly. A reproductive number of 1.02 means that each person who is diagnosed with COVID-19 gives it on average to slightly more than one other person. A reproductive number of more than 1 means that the epidemic is growing. The goal is to have enough people wear masks, stay at least 6 feet from others, and stay home and get tested when they are sick, so that Alaska’s reproductive number decreases to well below 1. Our reproductive number was below 1 as recently as late August.
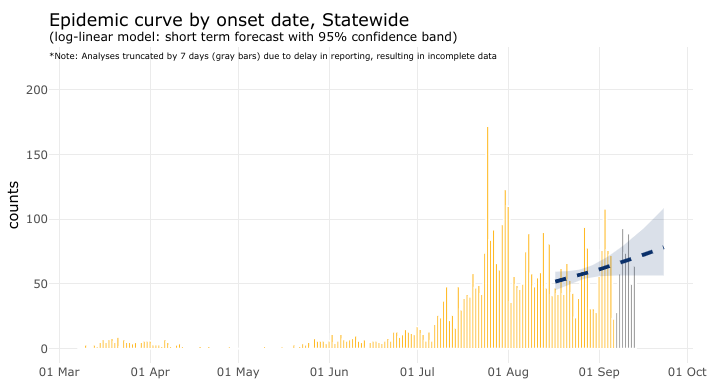
- An updated model epidemic curve now predicts Alaska’s cases to rise over the next week, a reversal in trend from recent weeks when cases had been predicted to decrease. Two weeks ago, cases were expected to halve every 75 days. One week ago, cases were expected to halve more slowly, every 210 days. As of this week, cases are now expected to double every 62 days, with a daily projected growth rate of 1.12%.
- Nonresident cases, which peaked in late July, decreased over August and continue to downtrend.
- Alaska continues to have both the fewest COVID-19 related deaths and the fewest COVID-19 related deaths per capita of any US state.
Regional trends
- Fairbanks North Star Borough has the highest rate of viral transmission with a case rate of 17.1, an increase from 13.7 last week and 10.8 a week before.
- Juneau City and Borough had the most quickly rising rate of viral transmission. Juneau more than doubled its case rate to 13.4 from 6.3 last week and 5.1 the week before.
- Anchorage Municipality and the Northwest Region both remain in the high transmission category but have improved slightly from last week.
- The Southwest Region’s case rate nearly doubled but remains in the low community transmission category.
- Other regions’ case rates downtrended this week.
Regional case trends


New cases, hospitalizations and deaths
- This week saw 513 new cases in Alaskans, a slight decrease from last week’s 541 new cases, for a total of 6,278 cumulative cases in Alaskans. 4,110 of those are considered active, or 65%, an increase from 63% last week, as only 2,168 Alaskans are thought to have recovered or completed their isolation period.
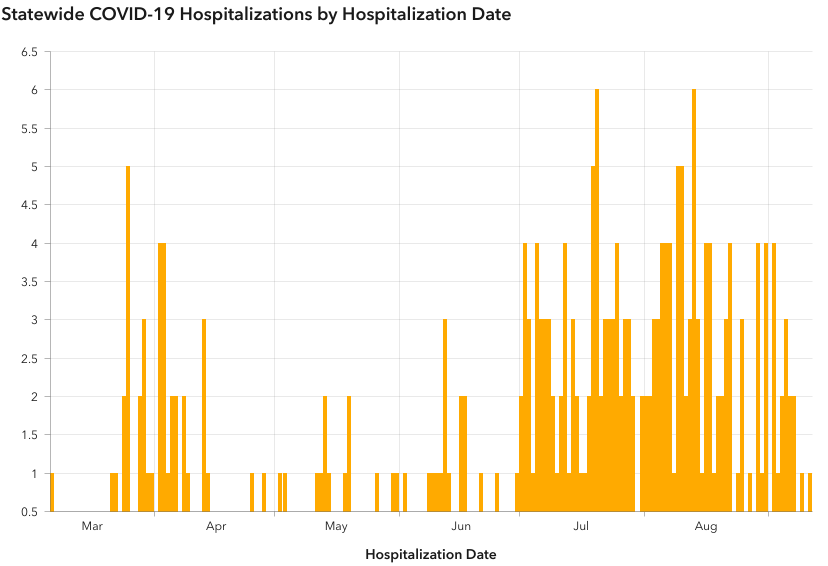
- Cumulative hospitalizations increased to 246 with 14 new this week, slightly fewer than the increase of 17 last week.
- Deaths among Alaska residents increased by 2 to 44 total.
- There were 24 nonresident cases identified this week, for a total of 915.
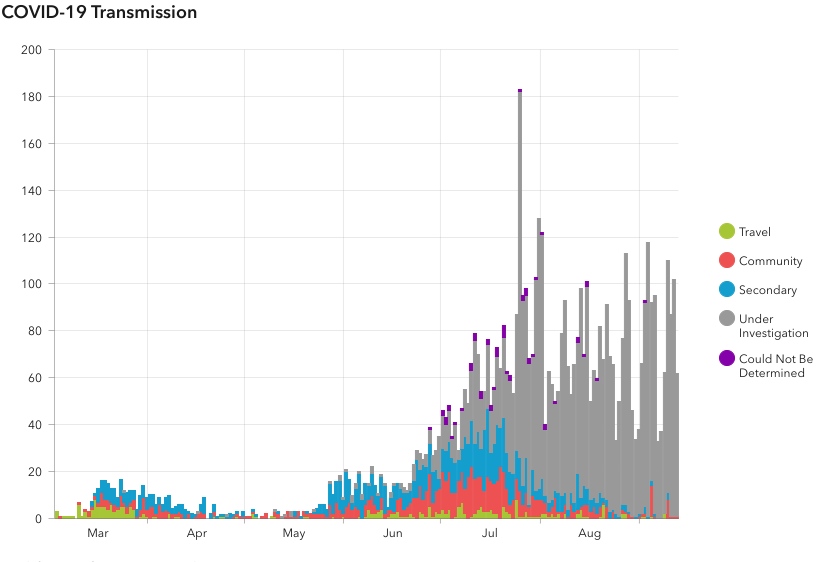
How COVID-19 spreads in Alaska
- The majority of new infections among Alaskans are from community spread, not from travel. Most Alaskans get the virus from someone they work, socialize, or go to school with.
- Many cases do not have a clear source, meaning that contact tracers have not been able to identify where the person got the virus. This could mean that there are cases in our communities that we do not know about.
- Many Alaskans who are diagnosed with COVID-19 report that they went to social gatherings, community events, church services and other social venues while they were contagious but before they knew they had the virus.
- The distribution of cases among people of different races and ethnicities has not changed significantly since last week.
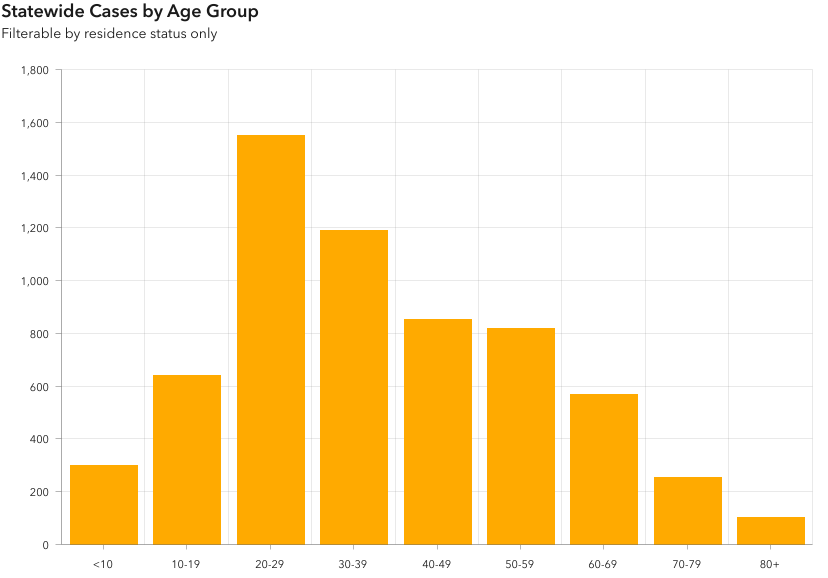
- Cases continue to increase most rapidly in young adult Alaskans, especially those aged 20-29.


Distribution of cases compared to population distribution and distribution of cases, hospitalizations and deaths by race and ethnicity
Includes data from all cases reporting one or more races. Based on these data, American Indian and Alaska Native as well as Native Hawaiian and Pacific Islander populations are disproportionately affected. One factor limiting interpretation is that a greater proportion of tests from the Alaska Native Tribal Health system currently have race indicated than tests from other sources, which may mean that cases in Alaska Native People are more likely to be reported as such than cases in people who receive care through non-tribal health systems. However, this should not significantly impact Native Hawaiian and Pacific Islander population case counts. Currently, cases in this population are nearly five times what would be expected based on estimated population (6.9% vs 1.4%).
If race or ethnicity is not identified with the initial test, contact tracers will attempt to collect this information, but these data are often delayed resulting in many cases (currently 2,889, or 45%) still labeled under investigation. Additionally, people who are hospitalized or have died with COVID-19 are more likely to have a race identified.
*Based on US Census Bureau 2019 estimates: https://www.census.gov/quickfacts/AK
**By federal convention, ethnicity is not mutually exclusive of race, so cases identifying Hispanic ethnicity are also counted under a race category.
Testing trends
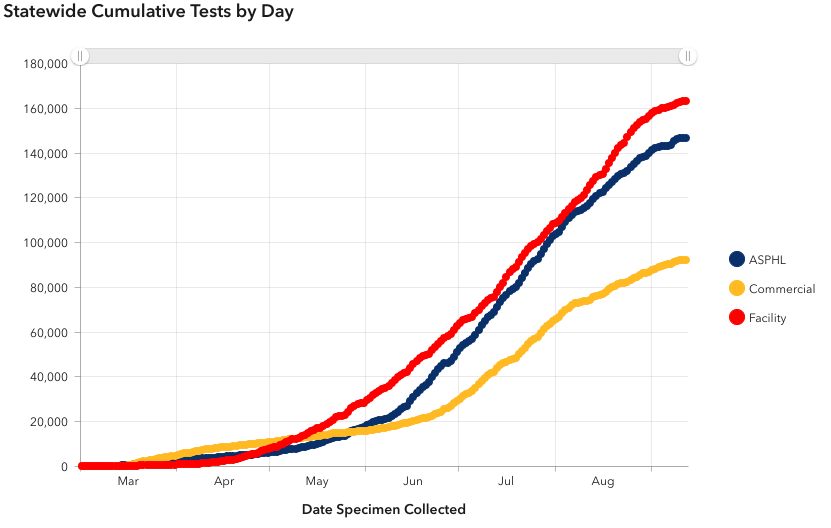
- Testing increased at a steady rate throughout May, June and July, but starting in mid-August, increases have slowed.
- Alaska has the capacity to continue expanding testing. DHSS can assist in materials for setting up new testing sites and is pursuing all avenues for expanding testing.
Positivity rates
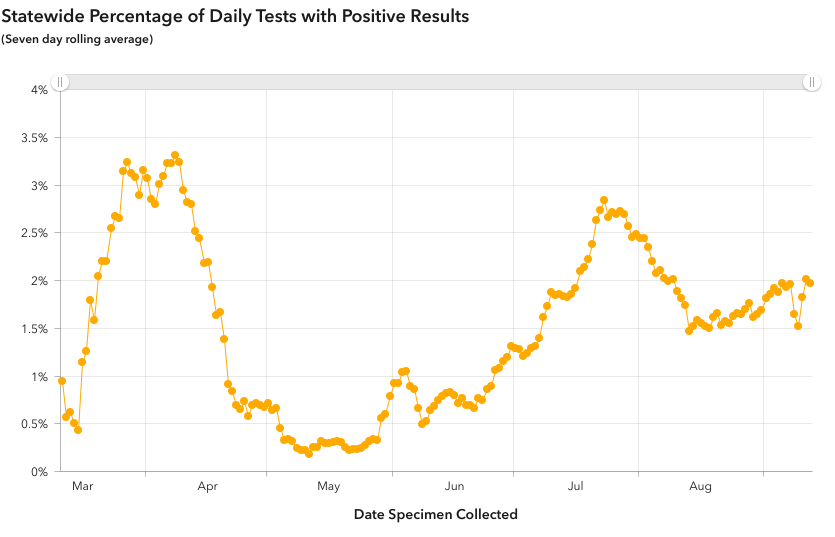
- The statewide test positivity rate, calculated by dividing the number of positive tests by the total number of tests performed over a given period of time, averaged over the past seven days, held steady at 2% this last week. Statewide test positivity has not been above 3% since April, and has never exceeded 3.5%.
- This is significantly better than the current national average test positivity rate of 4.8%. In comparison to other states, Alabama currently has a positivity rate of 16.4% and South Dakota, 16.6%, while New York, which peaked at 50.7% in early April, has greatly expanded testing since then and currently has a positivity rate of 0.9%. Source: Johns Hopkins
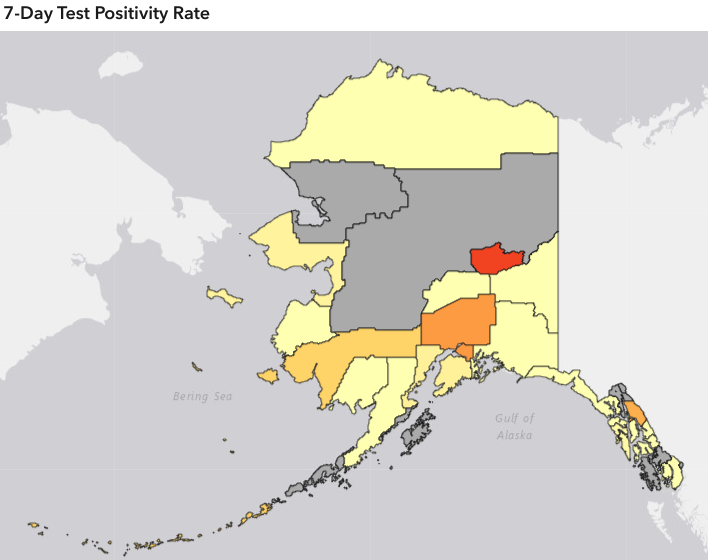
- Reported test positivity rate is currently highest in the Fairbanks North Star Borough, with a rate of 5.3%. It exceeded 5% on 9/10/2020.
- Test positivity is a good measure of whether testing is adequate in a given area, since it is affected by the number of tests performed as well as the number of new cases in an area. However, because it depends so much on the number of tests performed, it tells us more about whether we are doing enough testing than about how much virus is spreading in a community. A case rate can give good information about how much virus is spreading in a community, as long as the test positivity is low. A community test positivity rate under 5% is currently generally accepted as being low enough to estimate that a community’s case rate is reasonably accurate.
- In late August, Alaska led the nation in most tests per capita and continues to be among the top 3 states in tests per capita.
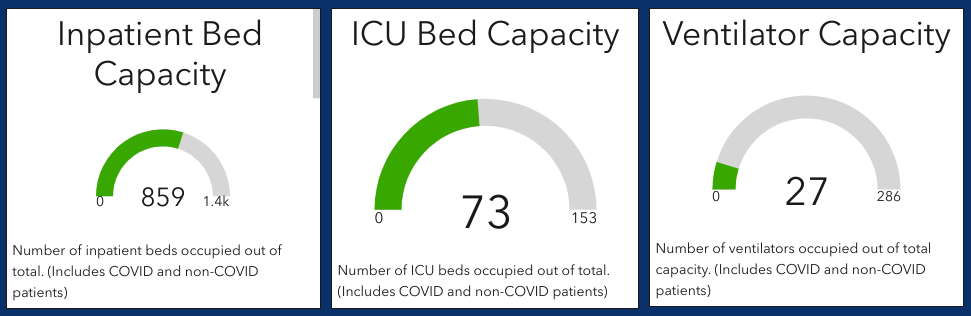
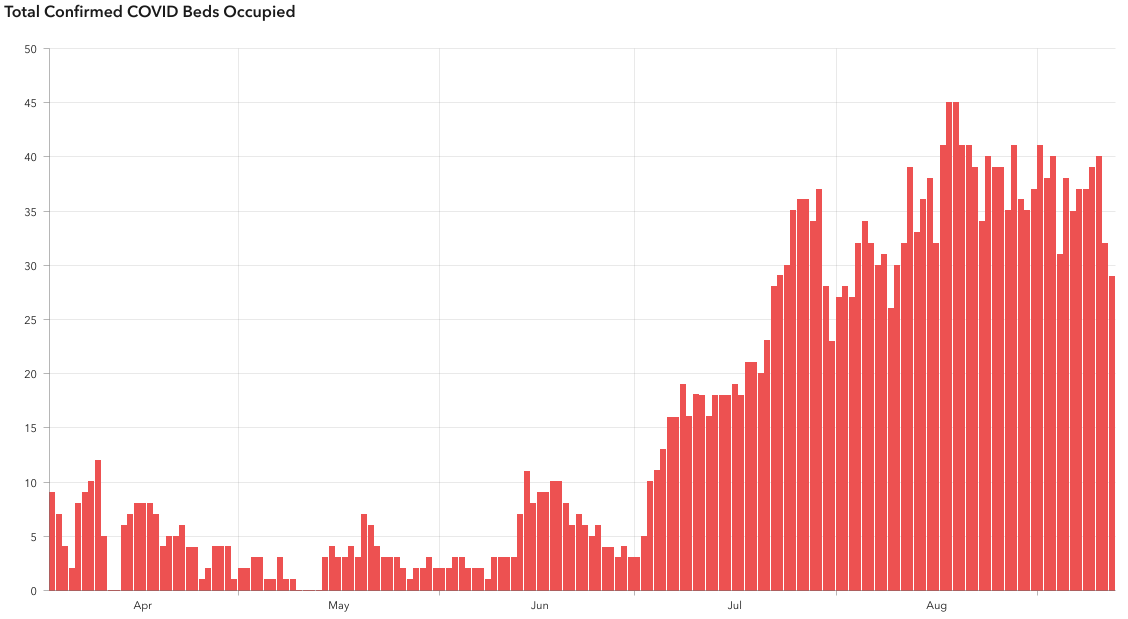
Health care capacity
Hospital bed occupancy statewide remains steady. Hospitalizations peaked in early August and have plateaued since then. Ventilator capacity remains adequate overall. Hospital data includes inpatient beds and ventilators located all around the state, including some in smaller hospitals without ICU capacity. Hospital beds do not necessarily represent staffed beds, as staffing can change quickly, particularly if a community has many health workers impacted by COVID-19.
What Alaskans should do
- Anyone with even one new symptom of COVID-19 (fever, chills, cough, shortness of breath, difficulty breathing, fatigue, muscle aches, body aches, headache, new loss of taste or smell, sore throat, congestion, runny nose, nausea, vomiting, or diarrhea), even if it is very mild, should get tested for COVID-19 right away. Tests are most accurate in the first few days of symptoms, and if the test is positive, getting tested right away helps contact tracers move as quickly as possible.
- Alaskans can help contact tracers work to slow the spread of COVID-19 by answering the phone promptly if contacted and providing accurate information.
- Alaskans should avoid gatherings, wear masks when around any non-household member, keep six feet of distance from anyone not in their household and wash hands frequently to slow community transmission of COVID-19.
Further information
- The Frequently Asked Questions webpage at is often the quickest route to an answer regarding testing, travel, health mandates and other COVID-19 information.
- Please see the State of Alaska COVID-19 information page for more information about the virus and how individuals and businesses can protect themselves and others from transmission.
- For the most up-to-date case information, see the Alaska Coronavirus Response Hub dashboard. Some data may change as more information comes to light through contact tracing and other public health work.
- For questions regarding DHSS COVID response, including mandates and alerts, email covidquestions@alaska.gov.
- For DHSS media inquiries, please contact clinton.bennett@alaska.gov .
| STAY CONNECTED: | |||||
| |
|||||
SUBSCRIBER SERVICES:
Manage Preferences | Unsubscribe | Help
Update your subscriptions, modify your password or email address, or stop subscriptions at any time on your Subscriber Preferences Page. You will need to use your email address to log in. If you have questions or problems with the subscription service, please contact subscriberhelp.govdelivery.com.
This service is provided to you at no charge by the Alaska Department of Health and Social Services.