|
Planning Releases New Neighborhood Profiles and Interactive
Mapping
The Planning Department is introducing a new set of data
tools for online use, that feature updated neighborhood profiles. The new neighborhood profiles combine population statistics from the 2000 and 2010 Census counts with socioeconomic data from the
2006-2010 American Community Survey 5-Year Estimates. The American Community Survey (ACS) is the
U.S. Census Bureau’s annual household survey, which replaced the ‘long form’
data collected during the 2000 Census.
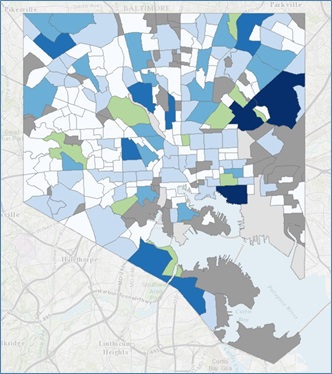 Above: Example of the
interactive neighborhood profile map.
The neighborhood profiles can be accessed in two ways. A direct link to the data tables can be found
here. In addition to data tables, the Planning Department created an
interactive map that highlights changes in population between the 2000
Census and the 2010 Census. The
interactive map includes a swipe feature, allowing you to pan back and forth between maps to view where the changes in population have taken place since 2000. The map
includes links to the detailed neighborhood profiles. Here is the link
to the interactive map (best viewed in Chrome or Firefox).
The interactive map can be used to view the following data
sets:
-
2000 Census
-
2010 Census
-
2006-2010 American Community Survey 5-Year
Estimates
The Planning Department partnered with Johns Hopkins University,
Sheridan Libraries, Morgan State University, University of Maryland, the
University of Baltimore, BNIA and the Jacob France Institute to update these
data profiles. The partnership contracted with the Census Bureau for a
special tabulation of the ACS data for Baltimore at the neighborhood-level,
since we are a “city of neighborhoods”, and the data is therefore much more useful.
When comparing the 2006-2010 ACS data with 2000 Census survey
data, here are some of the key citywide findings:
-
The percent
of the population with a bachelor degree or higher grew from 19% to 25%
-
The amount of
foreign born population grew by about 47%
When Mayor Stephanie
Rawlings-Blake announced her goal to grow the City by 10,000 households by
2020, Planning staff was confronted with the challenge of how to best monitor
population growth, knowing that there would not be any official count until the
2020 Census itself. To help gauge our progress, , the Planning Department is tracking new
residential units that reflect development trends throughout the City and signal additional
population and households. Units
within large development projects (those with 15 or more units) are calculated at
three stages:
-
Approved (eligible to submit a construction permit),
-
Under construction (construction permit
issued),
-
and Completed (use/occupancy permit issued).
 Approved residential developments are projects that are reviewed in the
Planning Department, and are tracked up until final approval. Units undergoing
approval are considered to be in the “planning pipeline,” or are currently
under review, whether for compliance with zoning, urban design or site
standards.
Analyzing permit data provided by Baltimore Housing, the Research and Strategic Planning
Division tracks these projects through the construction phase to
completion. A project reaches the completed stage once all the residential
units have received a use and occupancy permit.
Additional analysis
is conducted to determine the number of units for smaller residential projects
(fewer than 15 units), which are then added to the total unit count. To track
trends Planning uses 2010 as the base year, and will update the data on a
quarterly basis, which will then be published in future editions of the
Compass.
|
 Rounding out the analysis, the Planning Department relies on
Housing’s data on Vacant Building Notices to track the net increase or decrease in
residential vacancies in the City. Below are key findings from this quarter’s
report,
Development Status Since 2010 (~15 units or more)
Completed Units: Since
2010, 4,408 new housing units have been completed.
Under Construction:
3,232 units are currently under construction.
Approved: 1,729 units
are currently approved, or are in the planning pipeline.
Vacant Building Notices: Since 2010, the number of housing
units with vacant building notices have declined by 359 units.
A substantial number of units, or 3,936 units,
fall into the Additional Units category, which are those within individual
projects with fewer than 15 units.
|
 In the second quarter, overall residential permit activity (including additional units)
in the City increased 17 percent from the first quarter, or by 1,225 units. Approved units alone increased by 54 percent, followed by those under
construction at 7 percent, and completed at 4 percent. These numbers reflect growth in residential development throughout the City, and are a good
indicator of economic activity and potential
growth in population and households.
|
Department of
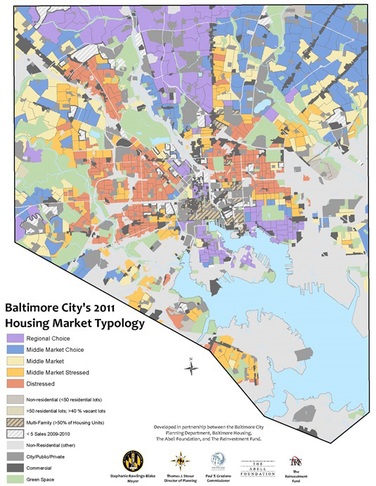
Planning Launches the 2014 Housing Market Typology
This July, the Department of Planning will kick off the 2014
Housing Market Typology (HMT) update. This will be the fourth analysis conducted of
Baltimore’s neighborhoods since the initial study in 2005. Every three years,
Planning works with the Department of Housing and Community Development (HCD)
and The Reinvestment Fund to develop a typology based on market factors to
assist with various public intervention strategies, ranging from code enforcement to targeting capital improvements to
acquisition, demolition and site assembly, throughout the City.
The typology will be used to assist city government, local
foundations and non-profits to understand local market strengths and to
appropriately match neighborhood strategies to market conditions for the best
use of public and private resources. In addition, the typology will inform neighborhood
level planning efforts, providing residents with an understanding of how local
housing market forces are affecting their communities.
Some of the primary uses in decision-making include the
following:
- Informing the Vacants to Value strategy to address the vacant housing
challenge.
- Informing the holding capacity (or build-out) used in developing the
City’s cooperative population forecast with the Baltimore Metropolitan Council.
-
Informing Neighborhood Master Plan and City Comprehensive Plan policies and
recommendations.
- Identifying the middle housing markets where traditional code
enforcement will be more effective.
- Identifying the distressed housing markets where traditional code
enforcement will be less effective.
This year the analysis will allow for the comparison with
the previous typology developed in 2011, depicting trends in the market over
the 2011-2013 period. With assistance from The Reinvestment Fund, City
staff will analyze the following variables:
- Median Home Sales Price
- Subsidized Rental Stock
- Commercial Land to Residential Ratio
- Housing Units per Square mile
- Residential Permits
- Vacant Lots & Vacant Properties
- Foreclosure Filings
- Owner vs. Renter Occupancy
The HMT process is guided by a Task Force consisting of non-profit
community organizations, community developers, foundations, and academic
institutions, as well as private entities such as banks and private developers.
Through a series of meetings and windshield surveys of the City, the
participants provide valuable input on the variables used in the analysis, and
the classification of the housing market types.
The final HMT will help government officials
and community stakeholders to identify and comprehend the various elements of
the local real estate market. These groups will then be able to craft targeted intervention
strategies in weak markets, and support sustainable growth in stronger market
segments. 2011’s typology is depicted below. The 2014 map will be available
on the Department of Planning’s website in early 2015.
 |